Along with the topic of sustainability of building projects at the 6D stage, modern construction emphasizes the environmental sustainability of projects. One of the key aspects of which is the assessment and minimization of CO2 carbon emissions that occur at all stages of the building life cycle.
Estimating and calculating carbon emissions of construction projects is a process in which total carbon emissions are determined by multiplying the volume attribute of the entities or group of entity-elements used in the project by a suitable carbon emission factor for the category.
Incorporating carbon emissions into the evaluation of construction projects as a component of the broader Environmental, Social, and Governance (ESG) criteria introduces an additional layer to the comprehensive assessment of the project.
Environmental, Social and Governance (ESG) are a broad set of principles that can be used to assess the corporate governance, social and environmental impact of a business, both internally and externally.
ESG, initially developed in the early 2000s by financial funds to provide investors with insights into the broad environmental, social, and governance criteria, has evolved to become a key metric for evaluating both companies and projects.
To determine emissions by type or category of element we need to collect the CO2 emission factors resulting from the production of different building materials such as concrete, bricks, recycled steel and aluminum.
The following table uses data from the UK ICE 2015 and US EPA 2006 databases. For each material in this table, two emission attributes (in kilograms of CO2 per kilogram of product) and volume-to-weight conversion factors (in kilograms per cubic meter) are provided.
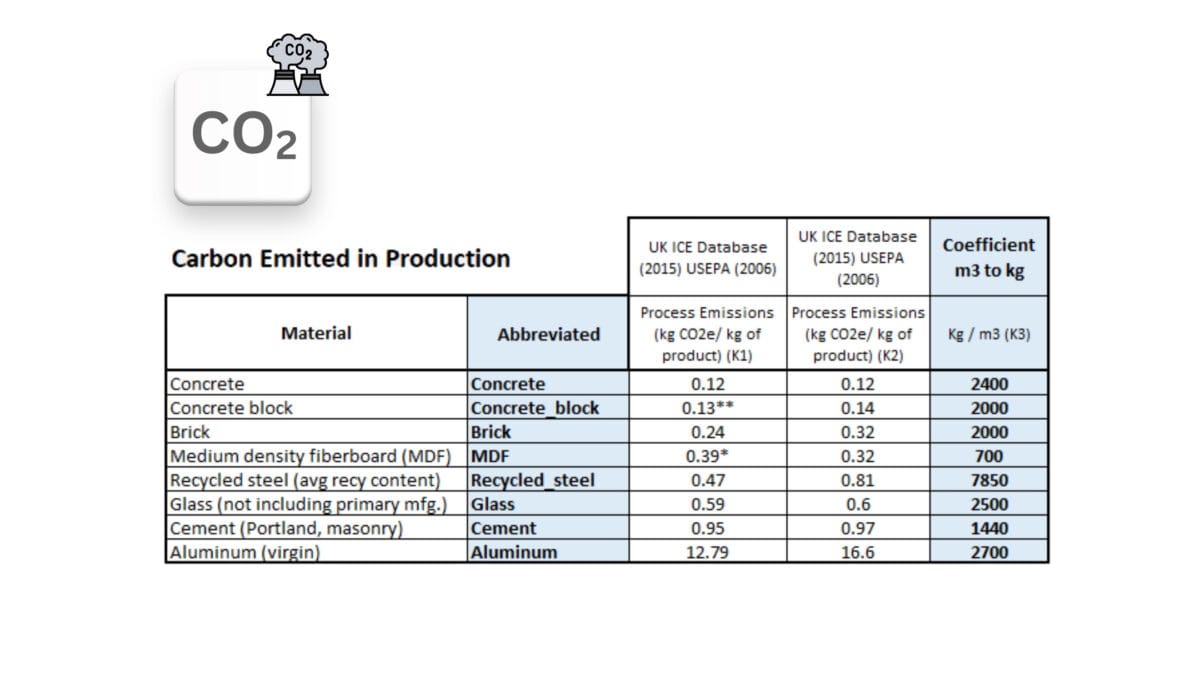
Amount of carbon emitted during the production of different building materials, according to the UK ICE and US EPA database
In order to calculate the total CO2 emissions of a project, it is necessary to define the attribute volume of each entity group. This can be done using the Quantity Take-Off (QTO) tools by obtaining attribute volumes in cubic meters, as detailed in the section "QTO Quantity Take-Off: Data Matching and Grouping". These volumes are then multiplied by the attribute “CO2 process emissions” factors for each material group.
Let's extract from the CAD (BIM) project automatically a table of volumes by element type by grouping all the data from the project, as we did in the previous chapters. Let's ask ChatGPT to do this.
❏ Text request to ChatGPT:
Please group the DataFrame table from CAD (BIM) of the project by the "Type Name" column parameter and show the number of items of each group and also summarize the "Volume" parameter for all items in the type. ⏎
➤ ChatGPT Answer:
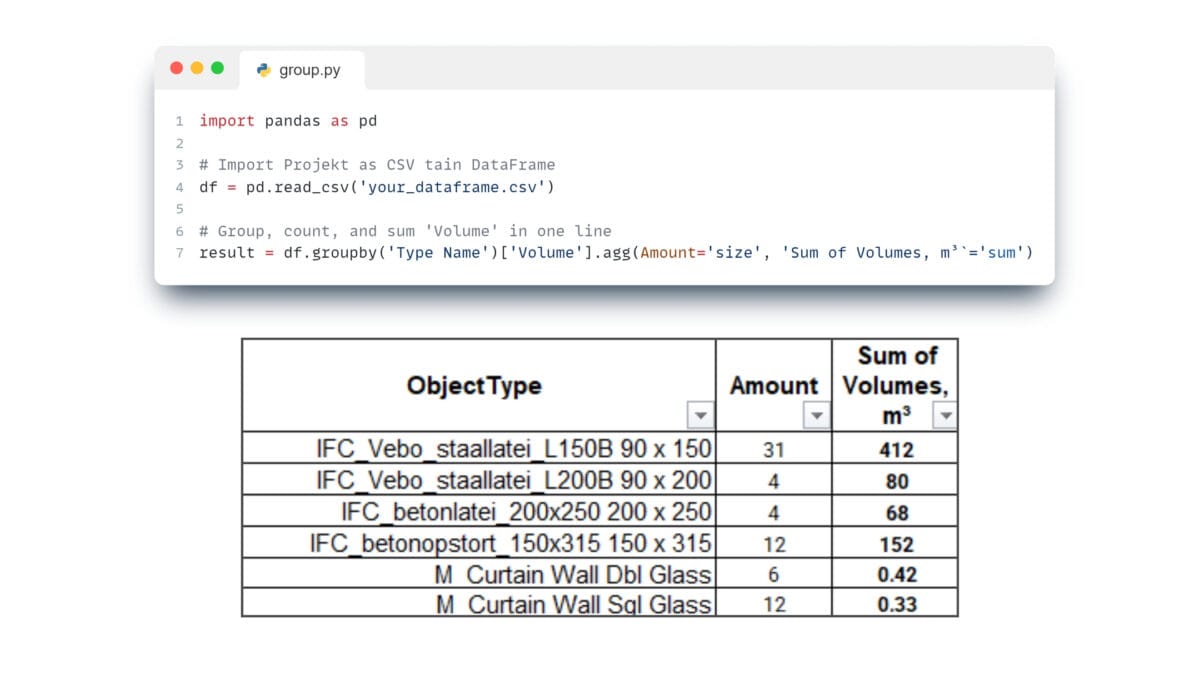
The generated code in ChatGPT clustered the project entities for us by type with the volume attribute summarized
To automate the process of calculating the total emissions for the entire project, we only need to set up automatic mapping in the same table or specify manually the correspondence between element types and material types from the emission factor table.

The integration of QTO and CAD (BIM) to estimate carbon emissions provides accuracy and automation in obtaining final emissions for each group and the entire project
A ready-made table with coefficients and formulas, as well as ready-made code for getting volumes from CAD (BIM) formats and automating CO2 calculations, can be found on GitHub by searching for "CO2_calculating-the-embodied-carbon".
Thus, the use of QTO and CAD (BIM) data to estimate carbon emissions in construction allows to automatically calculate the corresponding carbon dioxide emissions for different project variants with different materials, automatically selecting only those variants that meet the client's CO2 emission requirements.
Estimation of CO2 emissions by multiplying coefficients by volumes of grouped project elements is a typical example of a task in the processes of a construction company.
Similarly, by defining element group volumes, we can perform calculations for material control and logistics, quality monitoring and management, energy modelling and analysis, and a host of other tasks.
If the number of such calculation processes in a company starts to grow, the question arises as to whether it is necessary to build automation or use a specialized complex data management system (or data tables) to manage the rule tables and the projects themselves.
Medium to large companies in the construction industry, outsource such automation to ERP system development companies. Such companies use a single comprehensive system, known as a construction ERP (enterprise resource planning) system, to manage many different information layers, including material and resource calculations.