The transition from unmanaged data flow to its effective integration into business processes starts with converting data from closed formats to open formats.
In scientific research, the principle of sharing open data accelerates discovery and facilitates international collaboration among scientists. In medicine, sharing information between institutions leads to more effective diagnosis and treatment. In information technology, open-source applications allow developers around the world to collaboratively improve software.
A major benefit of open data is its ability to remove the dependence of application developers on specific platforms to access data.
The choice between open and closed data is an obvious one, as is the preference for structured data in automation, data processing and data warehousing processes. Structured data is often used by default in most systems because of its ease of processing and unambiguous interpretation, making it the most preferred type for communication and collaboration at the requirements and business process level.
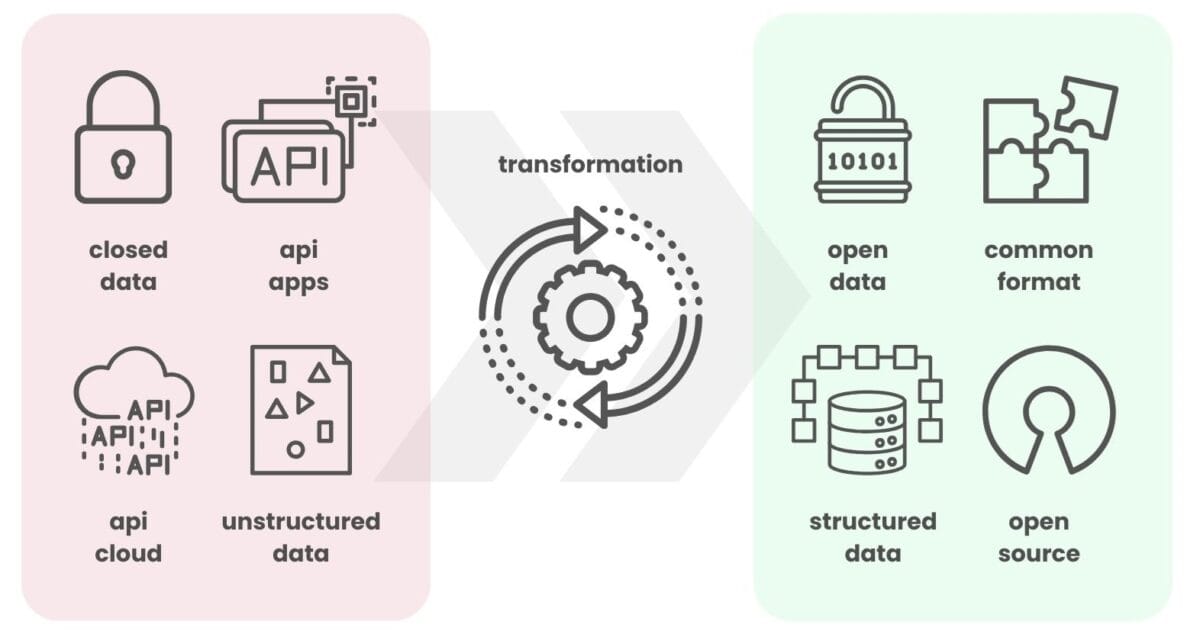
Open and structured data improves automation and collaboration, reducing dependence on specific platforms and accelerating innovation across domains
In the context of the construction industry, open structured data enables smooth and coordinated business processes where teams can focus on optimizing projects rather than struggling with incompatible data formats, platforms and systems.
To transform data into a structured format, a wide range of tools are available, where one of the most popular tools is the Python language library - Pandas.
Due to its flexibility and wide functionality, Pandas has become an indispensable tool for data scientists, automation and analytics professionals, facilitating the process of turning raw data into valuable information. We will use the Pandas library in conjunction with the ChatGPT tool in practical examples in the following chapters of this book, so let's take a closer look at these tools.
Pandas Python
Pandas library, occupies a special place in the arsenal of tools for working with data, becoming one of the most popular and demanded in this area.
In the world of analytics and structured data management, Pandas stands out for its simplicity, speed and power, providing users with a wide range of tools to effectively analyze and process information.
The Python programming language's Pandas library not only allows to perform basic operations such as reading and writing tables, but also to perform more complex tasks, including merging data, grouping data, and performing complex analytical calculations. Pandas can be compared to a Swiss knife for data analysts and data engineers.
As of January 2024, the number of downloads of the Pandas library is about 4.3 million per day.
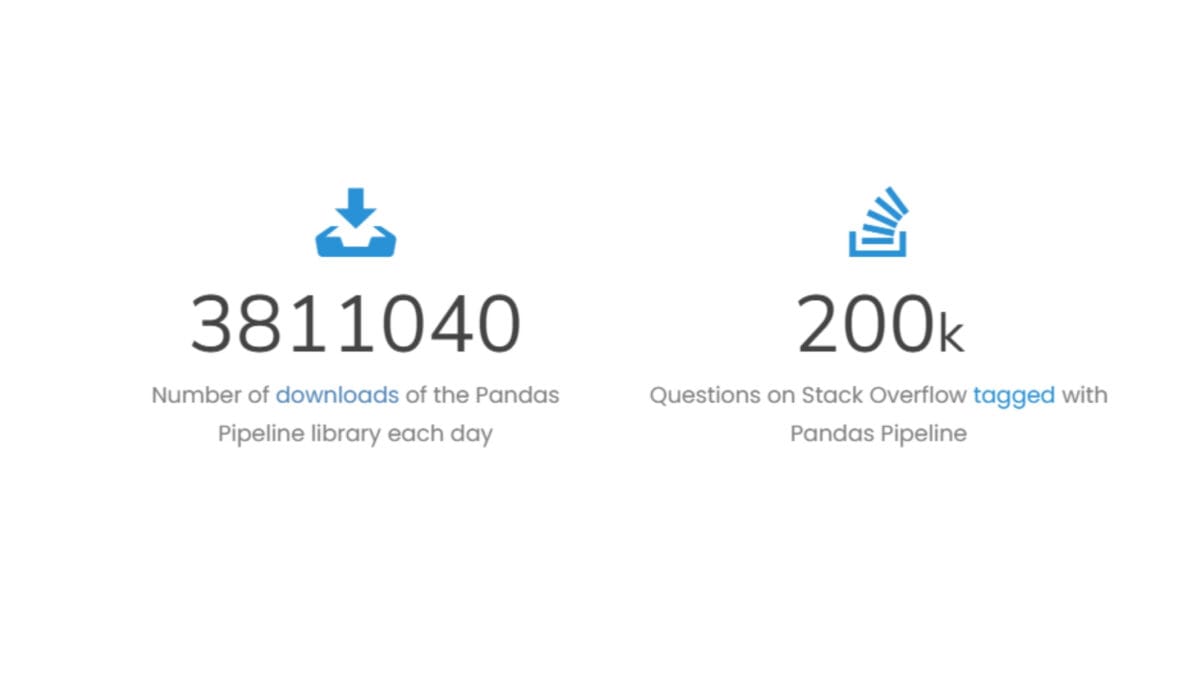
The Pandas data tool is one of the most popular libraries for transforming, analysing and processing data
The query language in the Pandas library is similar in its functionality to the SQL query language we discussed in the chapter "Relational Databases and SQL Query Language".
Both tools offer powerful data manipulation capabilities including sampling, filtering, sorting and grouping data. Pandas is often preferred in scientific research, process automation, Pipeline creation, and Python data manipulation, while SQL is the standard in database management and is often used in enterprise environments to work with large amounts of data.
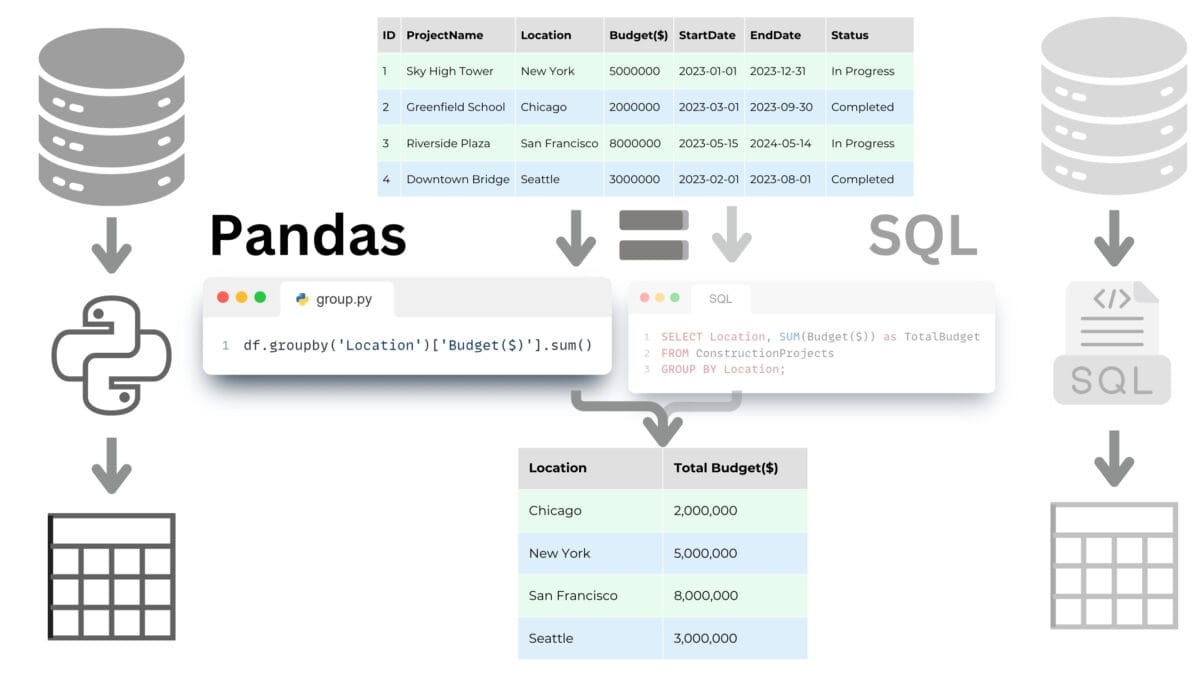
Pandas, unlike SQL, has the flexibility to handle a variety of data formats, not limited to databases
Using Pandas, it is possible to work efficiently with large amounts of data - much larger than what Excel can handle. Even when millions of rows are involved, Pandas can handle such tables with ease, providing powerful tools for analyzing, visualizing, and gaining valuable insights from the data. In addition, Pandas has strong community support: hundreds of millions of developers and analysts (Kaggle.com, Google Collab, Microsoft Azure Notebooks, Amazon SageMaker) around the world use it daily online or offline, providing a large number of out-of-the-box solutions for any business desire.
DataFrame
DataFrame in the Pandas library is the name of a two-dimensional data table with a flexible data structure. A DataFrame is organized as a table where each column contains data of the same type (e.g., numbers, strings, dates) and each row represents a separate data set, or record.
A DataFrame is a way of organizing data into a table very similar to the one you might see in Excel. In this table, the rows are individual records or entities, and the columns are the various characteristics or attributes of these item-entities.
For example, if we have a table with information about a construction project, the rows can represent the individual entities-elements of the project and the attributes-columns can represent their categories, parameters, position or coordinates of the BoundingBox elements.
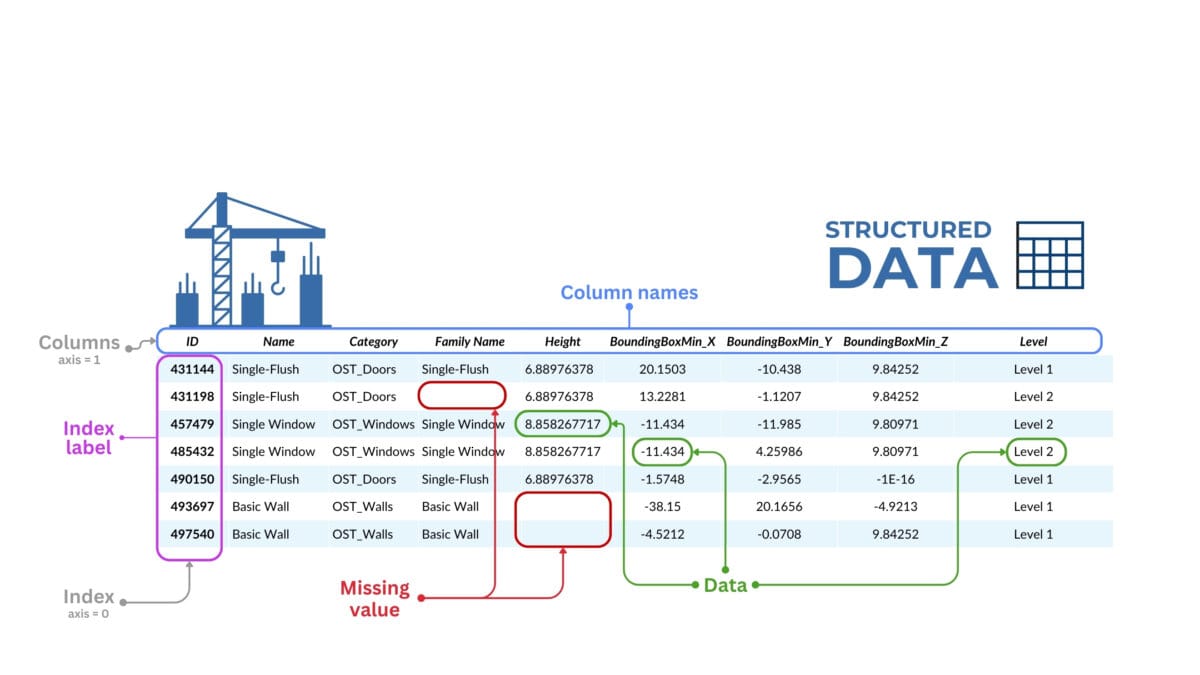
A dataframe of CAD (BIM) data is a two-dimensional table with row and column labels where data can be of different types
Let's list some of the key features and functionality of DataFrame in Pandas:
- Columns: in a DataFrame, data is organized in columns, each with a unique name. Columns-attributes can contain data of different types, similar to columns in databases or columns in tables.
- Rows: in a DataFrame can be indexed with unique values known as a DataFrame index. This index allows to quickly modify and manipulate data on specific rows.
- Index: by default, when a DataFrame is created, Pandas assigns an index from 0 to N-1 to each row (where N is the number of all rows in the DataFrame). However, the index can be modified so that it contains specific labels such as dates or unique identifiers.
- Indexing rows in a DataFrame means assigning each row a unique identifier or label, known as the DataFrame index.
- Data Types: DataFrame supports a variety of data types, including: `int`, `float`, `bool`, `datetime64` and `obect` for text data. Each DataFrame column has its own data type that defines what operations can be performed on its contents.
- Data operations: DataFrame supports a wide range of operations for data processing, including aggregation (`groupby`), merge (`merge` and `join`), concatenation (`concat`), split-apply-combine, and many other methods for manipulating and transforming data.
- Size Manipulation: DataFrame allows to add and remove columns and rows, making it a dynamic structure that can be modified according to data analysis needs.
- Data Visualization: using built-in visualization techniques or interfacing with popular data visualization libraries such as Matplotlib or Seaborn, DataFrame can be easily converted to graphs and charts to present data graphically.
- Data input and output: Pandas provides functions to read import and export data to various file formats such as CSV, Excel, JSON, HTML and SQL, making DataFrame a central hub for data collection and distribution.
These are just the main features and capabilities of DataFrame, but they already make it an indispensable tool for importing, organizing, analyzing, validating, and processing and exporting multi-format and multi-structured data. We will talk more about types of other formats Parquet, Apache orc, JSON, Father, HDF5 and data warehouses in the chapter "Modern data technologies in the construction industry".
The Pandas library and the DataFrame format, due to their popularity and ease of use, have become the primary tools for data processing and automation in the ChatGPT model (in 2023-2024). ChatGPT considers using Pandas and Python often the default when handling queries related to data validation, analysis, and processing.
ChatGPT and LLM
ChatGPT and other tools based on the use of large language models (LLMs) greatly simplify data collection, analysis, and automation. These tools allow users to formulate data queries, avoiding the cost of programmers or learning programming languages and various frameworks on their own.
ChatGPT, developed by OpenAI, is an artificial intelligence that processes natural language and uses extensive data from the Internet to answer queries.
In the past, data analysis required knowledge of the Python programming language and specialized libraries such as Pandas, Polars and DuckDB. By 2023, however, the process has become much simpler thanks to ChatGPT's ability to process text queries and provide accurate results without the need for manual coding. This textual communication capability has made code creation easier and data processing more accessible to a wider audience, becoming a significant breakthrough in usability.
In 2023, ChatGPT has made it much easier to create data processing and analysis applications, allowing users to get results without programming knowledge
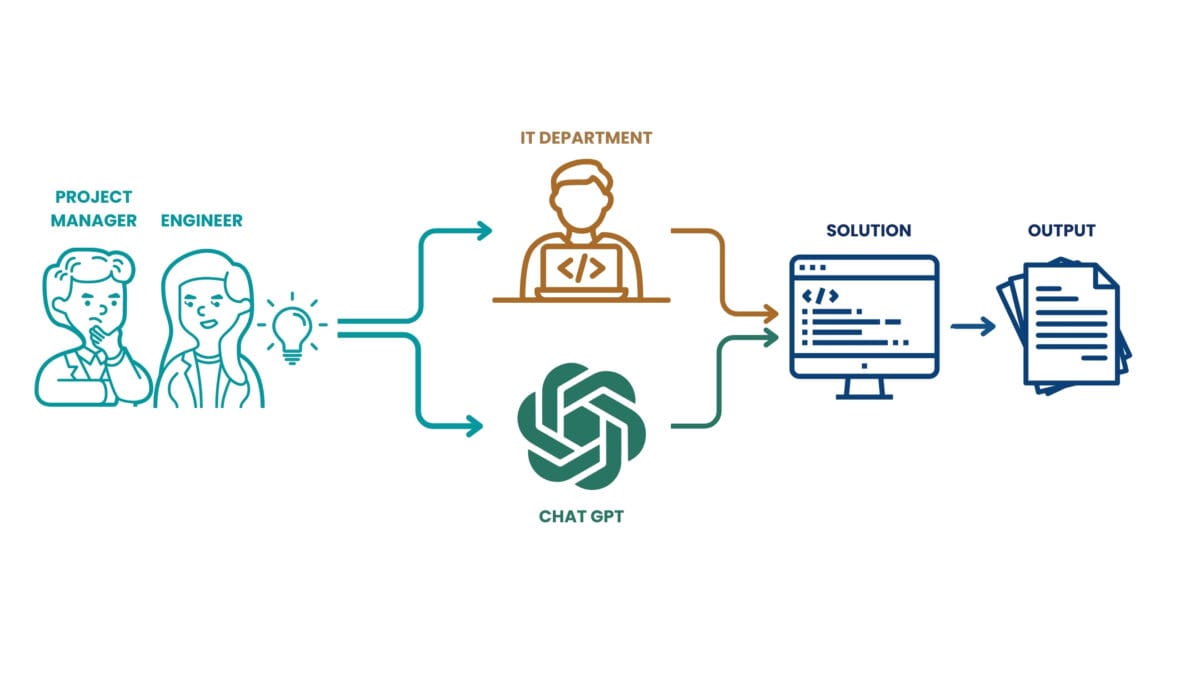
Just like at a certain point, users no longer need to understand how the internet works in order to use it or even create online applications or pages (CMS WordPress, Joomla, Drupal), specialists and engineers in construction companies without deep programming knowledge are now using tools like ChatGPT and LLaMA to automate the logic of processes and replace the functions of individual specialists or entire departments.
LLM chats such as ChatGPT and LLaMA allow professionals without deep programming knowledge to contribute to automating and improving a company's business processes.
Once we have familiarized ourselves with the main data types and tools for processing them, we are ready to move on to the first stage of working with data: opening closed formats and converting information from different formats into structured forms.