Application of Big Data in construction
26 February 2024
Example of Big Data based on CAD (BIM) data
26 February 2024

Big Data: analyzing data from a million building permits in San Francisco

Publicly available data on over one million building permits (records in two datasets) from the “San Francisco Department of Buildings” allows us to use this table-dataset to analyze not only construction activity in the city, but also to critically examine recent trends and history of the construction industry SF over the past 40 years, from 1980 to 2019.

The code examples that were used to create the entity attribute visualizations (4.4-12 to 4.4-15) and all the visual graphics with explanations and comments can be found on the Kaggle platform under the query "San Francisco. Construction Sector 1980-2019.".

By analyzing (with Pandas DataFrame) value data from 1,137,695 permits, it is clear that construction activity in San Francisco is closely tied to economic cycles, especially in the booming Silicon Valley technology industry. Economic booms and busts have had a significant impact on the number and value of construction projects. For example, the first peak in construction activity coincided with the electronics boom of the mid-1980s, and subsequent peaks and declines were associated with the dot-com bubble and the technology boom of recent years.

No trends or conclusions are apparent from the table itself, provided by the San Francisco Department of Buildings. Dry numbers are not the basis for decision-making. In order to make the data visually understandable, as we discussed in the "Data Visualization" chapter, the data was visualized using various libraries from the "Loading ETL: Visualizing Results as Graphs" chapter.

In San Francisco, the majority of the $91.5 billion invested in construction and renovation, nearly 75%, is concentrated in the downtown core and within a 2 km radius of downtown, reflecting the higher density of investment in these central zones. The average cost of building permits varies significantly by neighborhood, with applications in the downtown area costing three times as much as those outside the downtown area due to higher costs of land, labor, materials, and strict building codes requiring more expensive materials for energy efficiency.

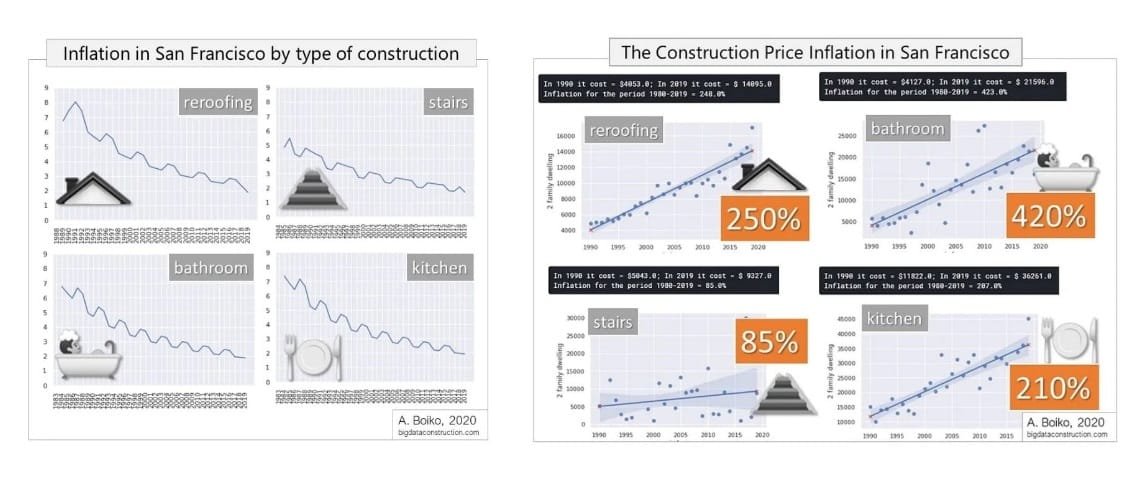
Dataset allows to calculate average repair prices not only by house type but also by city districts and individual addresses. In San Francisco, the dynamics of home remodeling costs show distinct trends for different types of remodeling and housing. Kitchen renovations are noticeably more expensive than bathroom renovations, with the average kitchen renovation in a single-family home costing about $28,000 compared to $25,000 in a two-family home.

The inflation of construction costs in San Francisco over the years can be traced by analyzing data grouped by housing type and year, showing a steady increase in the average cost of repairs since 1990 and identifying short-term 3-year cycles in the cost of repairs for multifamily buildings. The analysis highlights the variable and often unpredictable nature of construction costs in the city, which are influenced by a variety of factors including economic booms, technological advances, and specific requirements for different housing types.
Previously, analytics creation demanded expertise in programming languages and analytical libraries; however, the advent of tools like ChatGPT has made this process accessible and engaging for everyone in the construction industry, from on-site workers to company executives.

Just as we analysed data from the "San Francisco Building Department" tabular dataset we can visualise and analyse any data set from images and documents to data from the IOT or data from CAD (BIM) models.

Leave a Reply

Change language

Post's Highlights

Stay updated: news and insights


We’re Here to Help

Fresh solutions are released through our social channels

UNLOCK THE POWER OF DATA
 IN CONSTRUCTION

Dive into the world of data-driven construction with this accessible guide, perfect for professionals and novices alike.
From the basics of data management to cutting-edge trends in digital transformation, this book
will be your comprehensive guide to using data in the construction industry.

Related posts 

Focus Areas

Search

Search
Sorry, no articles found.

Don't miss the new solutions


Linux

macOS

Looking for the Linux or MAC version? Send us a quick message using the button below, and we’ll guide you through the process!


📥 Download OnePager

Welcome to DataDrivenConstruction—where data meets innovation in the construction industry. Our One-Pager offers a concise overview of how our data-driven solutions can transform your projects, enhance efficiency, and drive sustainable growth. 

🚀 Welcome to the future of data in construction!

You're taking your first step into the world of open data, working with normalized, structured data—the foundation of data analytics and modern automation tools.

By downloading, you agree to the DataDrivenConstruction terms of use 

Stay ahead with the latest updates on converters, tools, AI, LLM
and data analytics in construction — Subscribe now!

🚀 Welcome to the future of data in construction!

You're taking your first step into the world of open data, working with normalized, structured data—the foundation of data analytics and modern automation tools.

By downloading, you agree to the DataDrivenConstruction terms of use 

Stay ahead with the latest updates on converters, tools, AI, LLM
and data analytics in construction — Subscribe now!

🚀 Welcome to the future of data in construction!

You're taking your first step into the world of open data, working with normalized, structured data—the foundation of data analytics and modern automation tools.

By downloading, you agree to the DataDrivenConstruction terms of use 

Stay ahead with the latest updates on converters, tools, AI, LLM
and data analytics in construction — Subscribe now!

🚀 Welcome to the future of data in construction!

You're taking your first step into the world of open data, working with normalized, structured data—the foundation of data analytics and modern automation tools.

By downloading, you agree to the DataDrivenConstruction terms of use 

Stay ahead with the latest updates on converters, tools, AI, LLM
and data analytics in construction — Subscribe now!

🚀 Welcome to the future of data in construction!

You're taking your first step into the world of open data, working with normalized, structured data—the foundation of data analytics and modern automation tools.

By downloading, you agree to the DDC terms of use 

🚀 Welcome to the future of data in construction!

You're taking your first step into the world of open data, working with normalized, structured data—the foundation of data analytics and modern automation tools.

By downloading, you agree to the DataDrivenConstruction terms of use 

Stay ahead with the latest updates on converters, tools, AI, LLM
and data analytics in construction — Subscribe now!

DataDrivenConstruction offers workshops tested and practiced on global leaders in the construction industry to help your team navigate and leverage the power of data and artificial intelligence in your company's decision making.

Reserve your spot now to rethink your
approach to decision making!


🚀 Welcome to the future of data in construction!

By downloading, you agree to the DataDrivenConstruction terms of use 

Stay ahead with the latest updates on converters, tools, AI, LLM
and data analytics in construction — Subscribe now!

Have a question or need more information? Reach out to us directly!
Schedule a time to discuss your needs with our team.
Tailored sessions to help your team grow — let's plan together!
Have you attended one of our workshops, read our book, or used our solutions? Share your thoughts with us!
Name
Data Maturity Diagnostics

🧰 Data-Driven Readiness Check

This short assessment will help you identify your company's data management pain points and offer solutions to improve project efficiency. It takes only 1–2 minutes to complete and you will receive personalized recommendations tailored to your needs.

Clean & Organized Data

Theoretical Chapters:

Practical Chapters:

What You'll Find on
DDC Solutions:

  • CAD/BIM to spreadsheet/database converters (Revit, AutoCAD, IFC, Microstation)
  • Ready-to-deploy n8n workflows for construction processes
  • ETL pipelines for data synchronization between systems
  • Customizable Python scripts for repetitive tasks
  • Intelligent data validation and error detection
  • Real-time dashboard connectors
  • Automated reporting systems

Connect Everything

Theoretical Chapters:

Practical Chapters:

What You'll Find on
DDC Solutions:

  • CAD/BIM to spreadsheet/database converters (Revit, AutoCAD, IFC, Microstation)
  • Ready-to-deploy n8n workflows for construction processes
  • ETL pipelines for data synchronization between systems
  • Customizable Python scripts for repetitive tasks
  • Intelligent data validation and error detection
  • Real-time dashboard connectors
  • Automated reporting systems

Add AI & LLM Brain

Theoretical Chapters:

Practical Chapters:

What You'll Find on
DDC Solutions:

  • CAD/BIM to spreadsheet/database converters (Revit, AutoCAD, IFC, Microstation)
  • Ready-to-deploy n8n workflows for construction processes
  • ETL pipelines for data synchronization between systems
  • Customizable Python scripts for repetitive tasks
  • Intelligent data validation and error detection
  • Real-time dashboard connectors
  • Automated reporting systems
Big Data: analyzing data from a million building permits in San Francisco
This website uses cookies to improve your experience. By using this website you agree to our Data Protection Policy.
Read more
×