New data coming into the company's systems, or already collected and recorded in the form of documents, tables and databases from the property manager, architect, civil engineer, project manager and logistician must go through a validation process to ensure that it meets the requirements we have previously generated.
To validate new data coming into the systems - whether unstructured, textual or geometric - it must be converted into a loosely structured or structured format. In the validation process, each already transformed table of incoming or existing data should be checked against the complete list of required attributes and their allowed values.
The conversion of different types of data: text, images, PDF documents and mixed CAD (BIM) data into a structured form was discussed in more detail in chapter «Transforming Data Into Structured Form».
In the case of the CAD (BIM) database, which we have decomposed into a semi-structured geometry format and a structured element meta-information table, we are looking for attributes and their boundary values that other experts believe must be in the CAD (BIM) database before the data can be used outside the CAD (BIM) system.
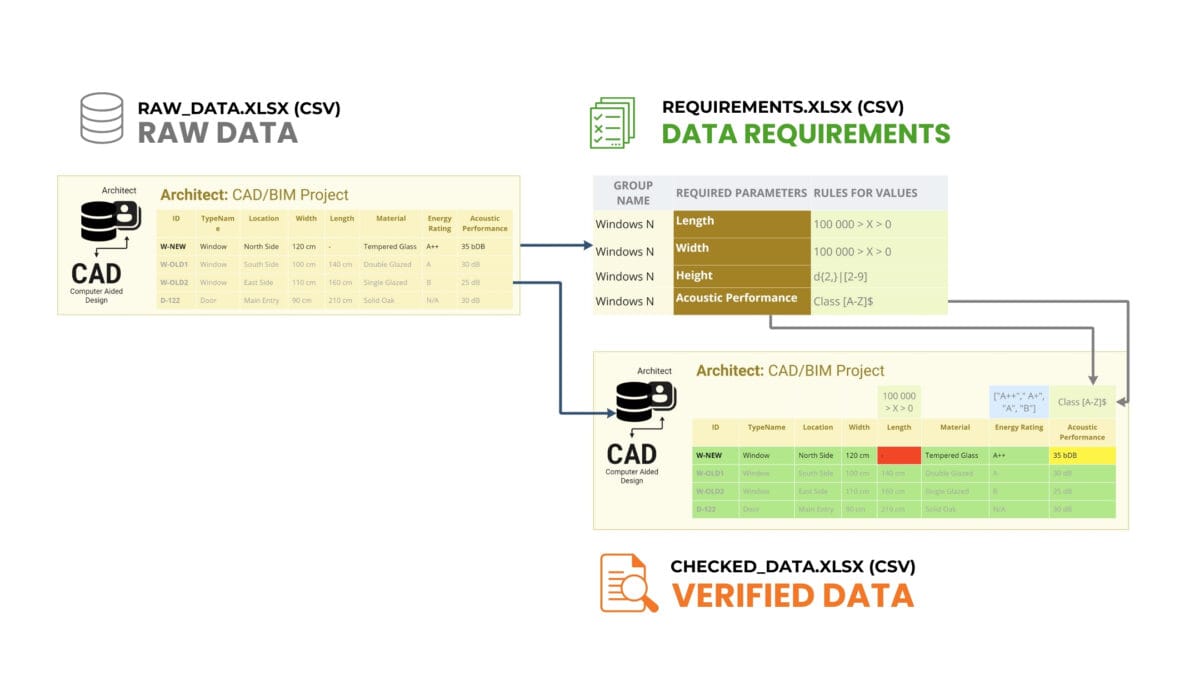
Table of meta-information attribute data of entities from CAD (BIM) and table with attribute requirements and their boundary values for window system entities
Using the Pandas library that we described earlier in the chapter "Pandas: An Indispensable Tool in Data Analysis", we will validate data from a tabular file extracted from a Revit® CAD (BIM) file (or IFC, DWG, DGN) using the requirements from another tabular file. Let's load the data from the raw_data.xlsx (Revit® CAD (BIM)) file and check it through the check and save the result to a new checked_data.xlsx file. Let's get the code to solve this problem using a text query in the ChatGPT language model, which we have already used in previous examples.
❏ Text request to ChatGPT:
Write code to validate the table from the raw_data.xlsx file, and validate them through validation rules: the values of the 'Width' and 'Length' columns are greater than zero, 'Energy Rating' is included in the ['A++', 'A+', 'A', 'B'] list, and 'Acoustic Performance' is not less than the specified minimum, with the addition of a validation summary column, and save the summary table to a new Excel file checked_data.xlsx ⏎
➤ ChatGPT Answer:
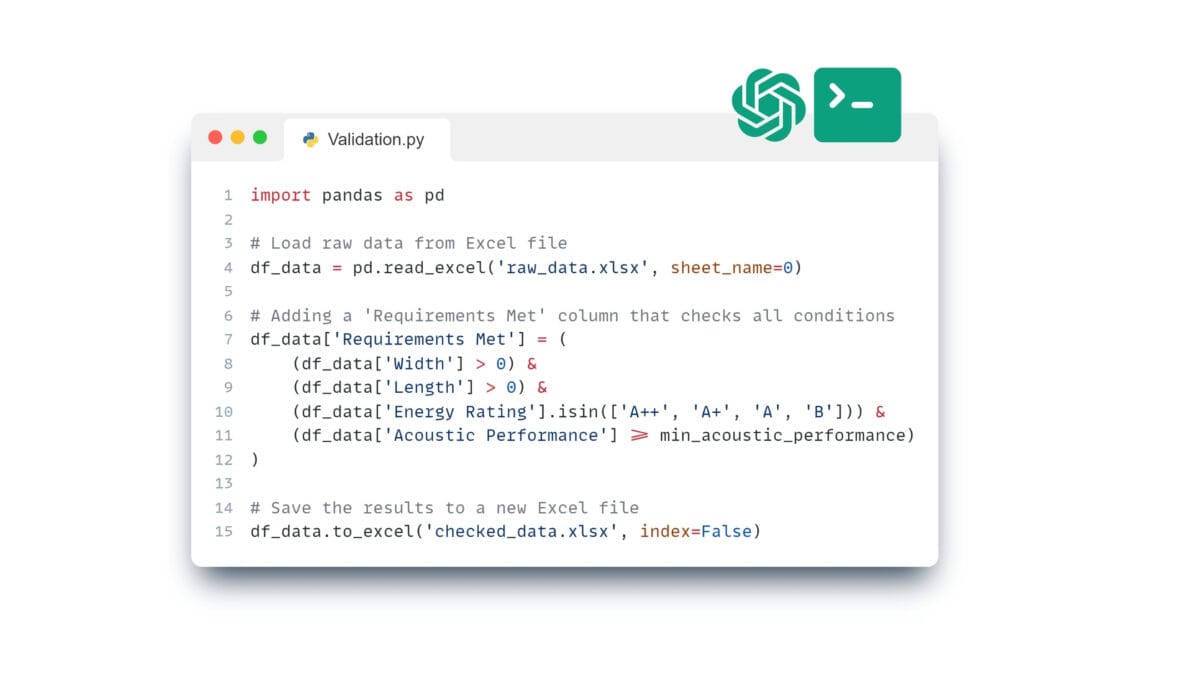
ChatGPT generated code that checks the transformed CAD (BIM) project against the attributes we generated as boundary values
This code can be run in one of the popular IDEs: PyCharm, Visual Studio Code (VS Code), Jupyter Notebook, Spyder, Atom, Sublime Text, Eclipse with PyDev plugin, Thonny, Wing IDE, IntelliJ IDEA with Python plugin, JupyterLab or popular online tools Kaggle.com, Google Collab, Microsoft Azure Notebooks, Amazon SageMaker.
Execution of the validation code will show that the "creature-elements" W-OLD1, W-OLD2, D-122 (and other elements) from the CAD (BIM) database meet the attribute requirements: width and length are greater than zero, and the energy efficiency class is one of the list values 'A++', 'A', 'B', 'C'.
The added new entity-element W-NEW, responsible for the new window on the north side, is non-compliant (Figure 2.6-7) because its length is zero and no energy efficiency class is specified for it (a value of None is considered unacceptable).
The result of the check identifies elements that have not passed the check and shows the results of the check e.g. as new attribute-columns ('False', 'True') or by highlighting incorrect values in the table
Similarly, we check the consistency of all the entities and required attributes for each of the systems, tables, databases in all the data we receive in this process of adding the window to the project.
For clarity in the resulting tables, we will mark in green those attributes and their values that are ready to be used in other construction project management systems and yellow (not critical) and red (critical) those attributes that do not meet the requirements for the entity of the window category.
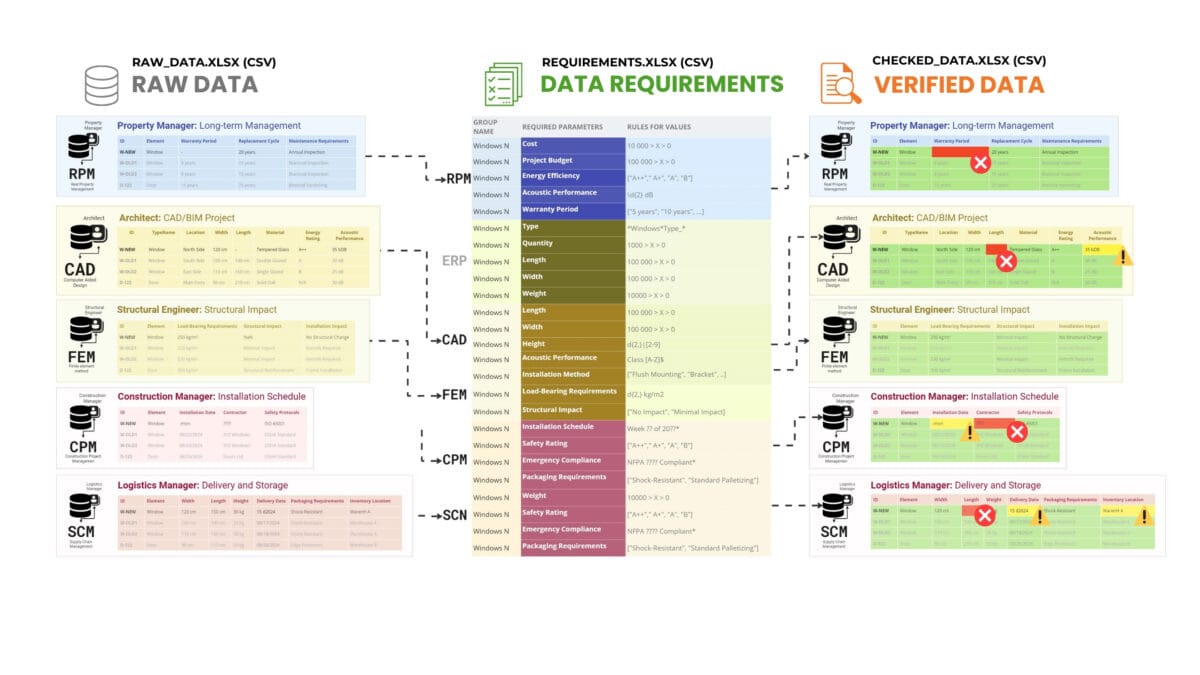
The result of the check allows us to visually identify which data are not compliant
As a result of verification, we get a list of trusted and verified entity-elements with their identifiers that have been verified against attribute requirements. Verified elements now provide assurance that these elements meet the stated standards and specifications for all systems involved in the window addition process (more about automating data verification and creating an automated ETL process we will talk in the chapter "ETL and Data Verification Automation").
In the process of construction project data validation, the validation results can be presented not only in tabular form, but also through various forms of visualisation for better analysis and a better understanding of the overall quality status of the various project entities.
Visualization options for validation results in addition to summary tables can include dashboards, charts, or PDF documents that categorize items into groups based, for example, on their status - green for validated items, yellow for items requiring attention, and red for unvalidated items.
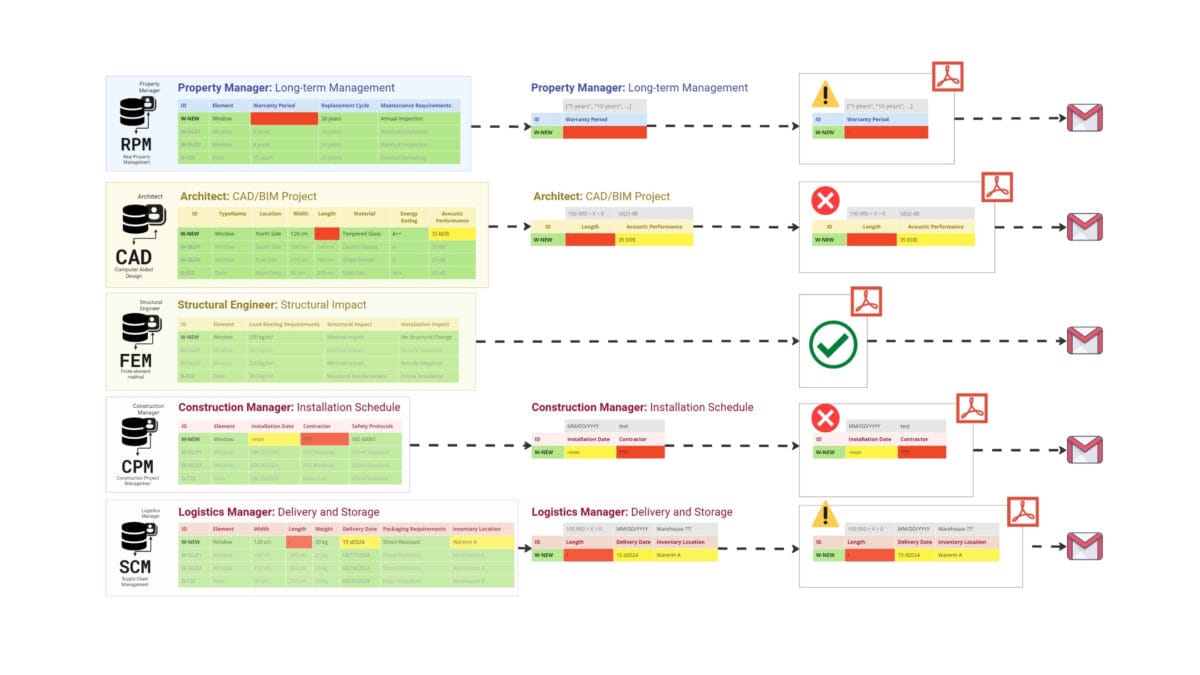
During the verification process, we consistently analysed the data (entities) from each system - from property management and CAD (BIM) data to installation schedules and logistics. In order to visualise the result of the audit, we will now automatically create suitable PDF documents for each specialist with a description of the results depending on the outcome of the audit:
Document without comment: "Thank you for working together."
Document with comments: "This document lists items and their attributes that have not passed the requirements validation."
Visualization of inspection results
Validation and automatic creation of reporting documents speeds up the process of finding and eliminating data deficiencies
With an automated validation process - as soon as an error or data gap is detected, we can instantly send a notification in the form of a message or a PDF document to the person responsible for the relevant data with a list of elements or entity groups with a description of the attributes that have not been validated
Visualization of inspection results in the form of automatically generated documents facilitates data interpretation and promotes effective interaction between project participants
For example, if a property management system receives a dossier that shows an incorrectly populated «Warranty Period» attribute, the property manager receives an alert with a list of their attributes that need to be checked and corrected. Similarly, any deficiencies in the installation schedule or logistics data cause a report to be automatically generated and an e-mail sent with the results of the audit to the appropriate specialist.
In addition to PDF documents and graphs with results, it is possible to create interactive 3D models with highlighting of elements with missing attributes, which allows users to visually use 3D geometries of elements to filter and evaluate the quality and completeness of data of elements in the project.
Visualization of the inspection results in the form of automatically generated documents, graphs or dashboards greatly simplifies data interpretation andfacilitates effective interaction between project participants.
Automating the data verification process has much in common with ETL procedures. In the chapter "ETL and Data Verification Automation" we will take a closer look at the topic of ETL and automation techniques for data verification.
After learning the basic types of data and systems, and mastering how to mine quality data to populate the systems, we move on to the key aspects of construction: estimating project cost and time, including volume estimation, costing, and scheduling.
Fresh solutions are released through our social channels
UNLOCK THE POWER OF DATA IN CONSTRUCTION
Dive into the world of data-driven construction with this accessible guide, perfect for professionals and novices alike. From the basics of data management to cutting-edge trends in digital transformation, this book will be your comprehensive guide to using data in the construction industry.
About 10,000 years ago, in the Neolithic era, mankind made a revolutionary transition in its development, abandoning the nomadic lifestyle in favor of sedentary life, which led to the appearance of the first primitive buildings...
The first documentary evidence in construction dates back to the period of pyramid building, around 3000-4000 BC (“Papyrus, 3rd century B.C. Language is Greek,” 2024). Since then, the keeping of written records has facilitated and...
At the heart of any process is the transformation of past experience into a tool for planning the future. Experience in the modern sense is a structured set of data, the analysis of which allows...
For millennia, the amount of information recorded in construction has barely changed, but it has grown rapidly in recent decades (Fig. 1.1-5). According to the PwC study® “Managed Data. What Students Need to Succeed in...
The era of modern digital data storage and processing began with the advent of magnetic tape in the 1950s, which opened up the possibility of storing and utilizing large amounts of information. The next breakthrough...
Today’s companies are faced with the need to integrate multiple data management systems. Selecting data management systems, managing these systems well, and integrating disparate data sources is becoming critical to business performance. In the mid-2020s,...
The process of integrating data into applications and databases relies on the aggregation of information from a variety of sources, including different departments and specialists (Fig. 1.2-4). Specialists search for relevant data, process it, and...
The construction industry is experiencing an unprecedented information explosion. If we think of business as a knowledge tree (Fig. 1.2-5) fed by data, the current stage of digitalization can be compared to the rapid growth...
In the last two years, 90% of all existing data in the world has been created (B. Marr, “How much data do we create every day? The Mind-Blowing Stats Everyone Should Read,” 2018). As of...
In recent years, more and more companies are outsourcing data storage to cloud services. For example, if a company hosts half of its data in the cloud, at an average price of $0.015 per gigabyte...
The evolution of data in construction is a journey from clay tablets to modern modular platforms. The challenge today is not to collect information, but to create a framework that turns disparate and diverse data...
Whether it is large corporations or medium-sized companies, specialists are daily engaged in filling program systems and databases with various interfaces with multiformat information (Fig. 3.2-1), which, with the help of managers, must interact with...
Today, most companies are facing a paradox: about 80% of their daily processes still rely on classic structured data – familiar Excel spreadsheets and relational databases (RDBMS) (М. Shacklett, “Structured and unstructured data: Key differences,”...
Data in information systems are organized in different ways – depending on the tasks and requirements for storing, processing and transmitting information. The key difference between the types of data models, the form in which...
One of the key challenges faced by construction companies during digitalization is limited access to data. This makes it difficult to integrate systems, reduces the quality of information and complicates the organization of efficient processes....
The construction industry was one of the last to address the problem of closed and proprietary data. Unlike other sectors of the economy, digitalization has been slow to develop here. The reasons for this include...
The construction industry is undergoing a shift that cannot be monetized in the usual way. The concept of data-driven, data-centric approach and the use of Open Source tools is leading to a rethinking of the...
While in past decades business sustainability was largely determined by the choice of software solutions and dependence on specific vendors, in today’s digital economy the key factor is data quality and the ability to work...
The emergence of Large Language Models (LLMs) was a natural extension of the movement towards structured open data and the Open Source philosophy. When data becomes organized, accessible and machine-readable, the next step is a...
Big language models (ChatGPT, LlaMa, Mistral, Claude, DeepSeek, QWEN, Grok) are neural networks trained on huge amounts of textual data from the Internet, books, articles and other sources. Their main task is to understand the...
The appearance of the first chat-LLMs in 2022 marked a new stage in the development of artificial intelligence. However, immediately after the widespread adoption of these models, a legitimate question arose: how secure is it...
Modern tools allow companies to deploy a large language model (LLM) locally in just a few hours. This gives complete control over data and infrastructure, eliminating dependence on external cloud services and minimizing the risk...
The next stage in the evolution of LLM application in business is the integration of models with actual real-time corporate data. This approach is called RAG (Retrieval-Augmented Generation) – Retrieval-Augmented Generation. In this architecture, the...
When diving into the world of automation, data analysis, and artificial intelligence – especially when working with large language models (LLMs) – it is critical to choose the right integrated development environment (IDE). This IDE...
Pandas occupies a special place in the world of data analysis and automation. It is one of the most popular and widely used libraries of the Python programming language(“Python Packages Download Stats,” 2024), designed to...
DataFrame is the central structure in the Pandas library, which is a two-dimensional table (Fig. 3.4-6) where rows correspond to individual objects or records and columns correspond to their characteristics, parameters, or categories. This structure...
In this part, we reviewed the key types of data used in the construction industry, got acquainted with different formats of their storage and analyzed the role of modern tools, including LLM and IDEs, in...
In the era of the data-driven economy, data is becoming the basis for decision-making rather than an obstacle. Instead of constantly adapting information to each new system and its formats, companies are increasingly striving to...
One of the most common tasks in construction projects is to process specifications in PDF format. To demonstrate the transition from unstructured data to a structured format, let’s consider a practical example: extracting a table...
In addition to PDF documents with tables (Fig. 4.1-2) and scanned versions of tabular forms (Fig. 4.1-5), a significant part of information in project documentation is presented in text form. It can be both coherent...
Structuring and categorizing CAD data (BIM) is more challenging because data stored from CAD (BIM) databases are almost always in closed or complex parametric formats, often combining geometric data elements (semi-structured) and metainformation elements (semi-structured...
From 2024, the design and construction industry is undergoing a significant technological shift in the use and processing of data. Instead of free access to design data, CAD -system vendors are focusing on promoting the...
Today’s design data architecture is undergoing fundamental changes. The industry is moving away from bulky, isolated models and closed formats towards more flexible, machine-readable structures focused on analytics, integration and process automation. However, the transition...
Effective data management requires a clear standardization strategy. Only with clear requirements for data structure and quality can data validation be automated, manual operations reduced and informed decision making accelerated at all stages of a...
As the number of digital systems within companies grows, so does the need for data consistency between them. Managers responsible for different IT systems often find themselves unable to keep up with the increasing volume...
In the context of digitalization and automation of inspection and processing processes, a special role is played by classification systems elements – a kind of “digital dictionaries” that ensure uniformity in the description and parameterization...
Historically, construction element and work classifiers have evolved in three generations, each reflecting the level of available technology and the current needs of the industry in a particular time period (Fig. 4.2-8): First generation (early...
Effective management of data (structured and categorized by us earlier) is impossible without a well thought-out storage and processing structure. To ensure access and consistency of information at the storage and processing stages, companies use...
Having a data model and description of entities through parameters, we are ready to create databases – storages, where we will store information coming after the structuring stage on specific processes. Let’s try to create...
With data becoming one of the key strategic assets, companies need to do more than just collect and store information correctly – it is important to learn how to manage data systematically. The Center of...
We use cookies to personalise content and ads, to provide social media features and to analyse our traffic. We also share information about your use of our site with our social media, advertising and analytics partners who may combine it with other information that you’ve provided to them or that they’ve collected from your use of their services.
Cookies are small text files that can be used by websites to make a user's experience more efficient.
The law states that we can store cookies on your device if they are strictly necessary for the operation of this site. For all other types of cookies we need your permission. This means that cookies which are categorized as necessary, are processed based on GDPR Art. 6 (1) (f). All other cookies, meaning those from the categories preferences and marketing, are processed based on GDPR Art. 6 (1) (a) GDPR.
This site uses different types of cookies. Some cookies are placed by third party services that appear on our pages.
You can at any time change or withdraw your consent from the Cookie Declaration on our website.
Learn more about who we are, how you can contact us and how we process personal data in our Privacy Policy.
Please state your consent ID and date when you contact us regarding your consent.
Welcome to DataDrivenConstruction—where data meets innovation in the construction industry. Our One-Pager offers a concise overview of how our data-driven solutions can transform your projects, enhance efficiency, and drive sustainable growth.
You're taking your first step into the world of open data, working with normalized, structured data—the foundation of data analytics and modern automation tools.
By downloading, you agree to the DataDrivenConstruction terms of use
You're taking your first step into the world of open data, working with normalized, structured data—the foundation of data analytics and modern automation tools.
By downloading, you agree to the DataDrivenConstruction terms of use
You're taking your first step into the world of open data, working with normalized, structured data—the foundation of data analytics and modern automation tools.
By downloading, you agree to the DataDrivenConstruction terms of use
You're taking your first step into the world of open data, working with normalized, structured data—the foundation of data analytics and modern automation tools.
By downloading, you agree to the DataDrivenConstruction terms of use
You're taking your first step into the world of open data, working with normalized, structured data—the foundation of data analytics and modern automation tools.
By downloading, you agree to the DataDrivenConstruction terms of use
DataDrivenConstruction offers workshops tested and practiced on global leaders in the construction industry to help your team navigate and leverage the power of data and artificial intelligence in your company's decision making.
Reserve your spot now to rethink your approach to decision making!