Of the hundreds of different business processes that affect the survival of a company operating in the construction industry, some of the main ones, as they were thousands of years ago, are the processes of qualitative calculation of element group quantities, project costing and time.
It was commodity-money relations that were one of the main reasons for the emergence of written language. And it was commodity-money relations thousands of years ago that formed the first legally significant clay tablets of calculations of materials and works in construction projects.
While for tens of thousands of years estimating processes remained unchanged and calculating project scope was a manual process, with the advent of ERP and CAD tools, the traditional world of estimating is becoming automated.

Of the thousands of different solutions and applications, the systems responsible for cost and time performance attract the most business attention
The main interest of a construction business is centred on the time and cost data of the work in a project. Estimating and costing departments pump up their calculation skills with each project in order to reduce the calculation error. Historical cost and process time data is collected during the construction of past projects throughout the life of a construction company and recorded in systems databases. The availability and quality of this data is a major competitive advantage for any construction organisation.
To understand the process of creating estimates, costings, and schedules in construction, we will draw a parallel to costing and calculating the cost of dinner at a restaurant.
To determine the total cost of an evening at a restaurant, a manager would need to make a grocery list and calculate the preparation time for each dish, then multiply the resulting costs by the number of guests. Similarly, in construction, we develop itemized costings for each category of project elements (entities), resulting in a total project cost by summing the costs of all categories-entities in the final estimate.
Calculations in the world of construction are kitchen recipes from building resources and materials.
In the very first stage of calculating the cost of the entire project and in the form of calculations and schedules, it is necessary to first collect in the form of a table all the items, work and resources that the company operates in the execution of its construction projects.
Information on all elements that can be used in construction projects is collected in the company's "Construction Resources, Materials and Works Database" and this database (or table) is a key source for all subsequent cost and time calculations.
Database of construction resources, materials and works
Database or table of construction resources, materials and works - includes detailed information about each entity element – article, material, work or service, including its name, description, unit of measurement and unit cost recorded in a structured form.
Everything from the variety of fuel and stock materials used in projects to detailed descriptions of professionals in various categories by hourly wage can be found in this table.
"Resource database" is akin to an online store's product catalog, in which each product has a detailed description of its attributes. This makes it easier for estimators to select the right resources needed to calculate specific construction processes - works.
"Building Resource Database" can be thought of as a listing of all the ingredients in a restaurant cookbook. Each building material, equipment and service is similar to the ingredients used in recipes. "Resource database" is a detailed list of all ingredients - building materials and services, including their cost per unit: piece, meter, meter, hour, liter, etc.

A resource table is like an ingredient list in a cookbook, describing each material and service with its cost
New entity items can be added to the «Construction Resource Databases» table in two ways: manually or automatically by integrating with the company's inventory control systems or supplier databases.

"Construction Resource Database", includes all articles (entities) and works with itemized information about material, service and their cost
To keep up with changing market conditions such as inflation, the "cost attribute" for each unit of an entity (good or service) in the system is updated regularly, which can be monthly, quarterly or annually, ensuring that costing and estimates are up-to-date and accurate.
A typical medium-sized construction company uses a database containing thousands to tens of thousands of such elements-entities. These minimum units - described entities serve as the basis for estimators who prepare estimates based on them.
Calculation items and composition of works
Having filled the "Construction Resource Database" with entities, we can now proceed to the creation of calculations that are calculated for each process on the construction site for specific units of measurement: for example, for one cubic meter of concrete, one square meter of gypsum board wall, per meter of curb or for the installation of one window.
To build a 1m² brick wall requires approximately 65 bricks (entity «Sand lime brick»), attribute a cost of $1 each (attribute "Cost per unit"), which adds up to $65. We also need to use construction equipment (entity «JCB 3CX loader») for 10 minutes, which will place the bricks near the work area. Since it costs $150 per hour (attribute "Cost per unit") to rent the machinery, 6 minutes of using it will cost about $25. In addition, 2 hours of labor by a mason-laying contractor will be required, with an hourly rate of $30, for a total of $60.

A company's costing base is similar to a restaurant cookbook: it contains a detailed list of building materials and services required for the operation, just as a recipe specifies the ingredients for a dish
The composition of the recipe-calculations are formed on the basis of the accumulated experience of the company, which has a track record of performing these works: laying tens of thousands of cubic meters of concrete, erecting hundreds of thousands of square meters of gypsum cardboard structures, installing kilometers of curbstone or hundreds of windows.
Just as a recipe describes the necessary ingredients and quantities to prepare a dish, a costing sheet provides a detailed list of all the construction materials and services needed to prepare a particular work.
Dozens and hundreds jobs performed dozens and hundreds of times - give workers, foreman and estimator data on the approximate representation of the work in resources, materials, liters of diesel and labor hours per unit of measurement. These volumetric and quantitative attributes of the entities are entered into the costing systems in the form of tables describing each individual task and work consisting of minimal entities from the resource base.

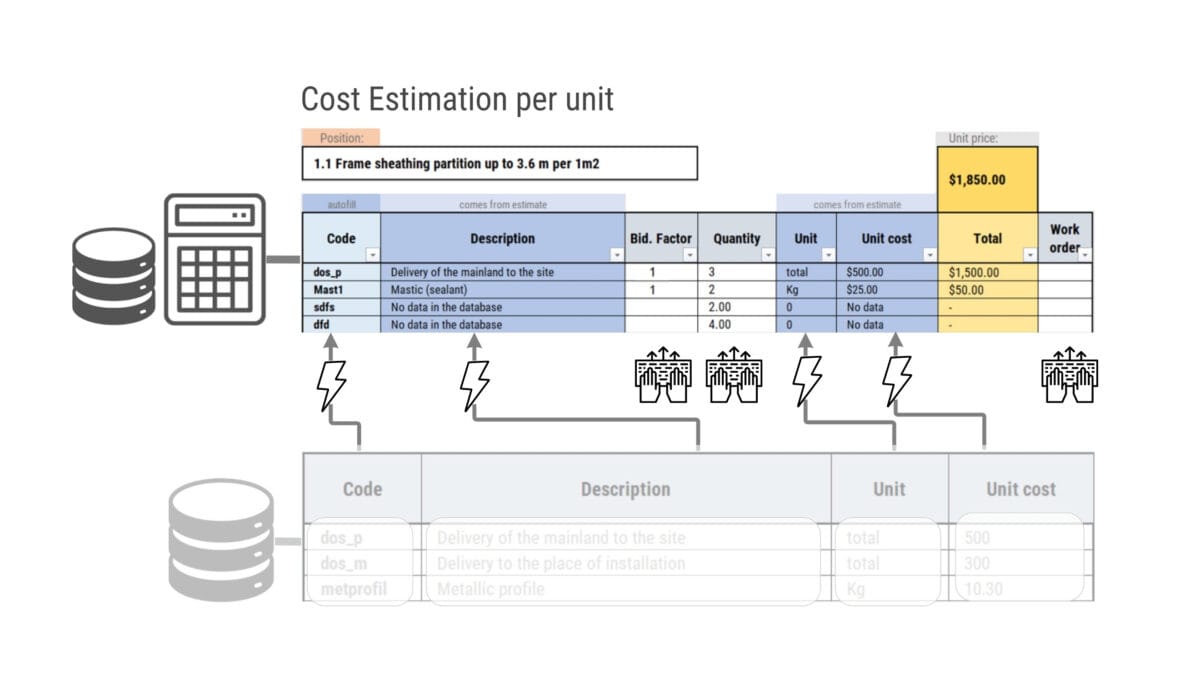
For each task-work, the volume attribute of an entity is multiplied by its quantity (attribute «quantity» and «bid factor») with the addition of the company's profit percentage and speculation percentage
To obtain the total cost of each entity in the work costing, the cost attribute of the entity is multiplied by its quantity and a Bid Factor. Bid Factor can take into account various factors such as complexity of the work, risks, expected overheads and profit.
Thus, the total price of the entire minimum entity per unit of measurement (square meter, cubic meter or piece) made up of articles reflects both the direct costs of materials and labor and the company's additional costs and margins.
The estimator, acting as an analyst, translates the words of the site foreman into repetitive estimates and describes construction processes through resource entities in the form of a table.
Having these objects, we make a unit costing (metre of concrete, square metre of wall), taking into account the experience of the company, adding only the quantity and the bid factor to get the total cost of each work
Depending on the size of the company, the number of task-work calculations can reach hundreds or thousands. Created calculations are stored in the form of tables - templates for typical projects, which are directly linked to the resource base. If the price attribute of an entity (product, material) changes in the resource base, this attribute is automatically changed in the costing table, which allows estimators to update only the resource base (Figure 3.1-6), while work and task costings can remain unchanged for a long time.
These costing templates are not immutable - a copy of the standard costing template is taken for a new project, and then in this copy certain activities are adjusted to meet the needs of the specific project without affecting the standard costing template. Calculations in order to adapt to individual client requirements and opportunities to increase profitability through speculation, maintaining a balance between maximizing revenue, meeting client needs and maintaining a good reputation for the company.
In some countries, such costing templates, accumulated over decades on a national scale, in order to standardize mark-ups and ensure transparency of the cost of works, are turned into state standards (costing recipes) to be followed by all companies operating in the construction market of a given region in projects with state participation.
Creating a project estimate
Once the costing of the individual work-tasks is ready, the next step is to multiply the cost of each work by its volume attribute in the new project.
In the process of calculating the total cost of a construction project, the key step is to summarize the costs of all individual costing work-items multiplied by the volume of this work in the project.
To create the total cost of a project, we start by calculating the cost of building one square meter of wall and multiplying the cost of its calculation (e.g. work - "1m2 of standard wall element installation") by the total number of square meters of walls in the project (e.g. the "Volume" or "Quantity" attribute of the Type "Wall Elements" entity from the CAD (BIM) project). Similarly, we apply this method to all categories of project elements listed in the estimate, multiplying the cost of each element by its volume in this project, which allows us to form a complete estimate of the entire project.

In estimating the entire construction project, the cost of each cost activity is multiplied by the scope attribute of the corresponding entity in the project. The summation of all these costs gives the total project cost
In the context of a restaurant, the final cost of the event is calculated similarly and equals the final cost of the entire dinner, where the cost of each course multiplied by the number of guests adds up to the total cost of the check.
Just as a restaurant owner multiplies the cost of each meal by the number of servings to determine the total cost of the event, a construction manager adds up the cost of all project components to arrive at a complete construction estimate.

The final estimate is calculated by multiplying the cost of each item, taking into account the speculation behind them, by the number needed
Thus, for each work in the project, its final cost is determined, which, multiplied by the attribute volume of the entity corresponding to this work - gives the cost of the work groups, from which the final cost of the entire project is obtained. The total project cost presents a financial picture of the project, allowing developers and investors to understand the overall budget and the financial resources required to realize the project.
For millennia, the traditional method of calculating volumes has been manual methods of measuring volumetric and quantitative attributes using paper drawings and calculators. With the advent of the digital age, companies have discovered that this same information can now be automatically extracted from geometric data from CAD (BIM) models, revolutionising the way millennia-old ways of working with quantitative data, calculations and computations.
And if the processes of compiling resource bases, calculations and estimates are already perfected and semi-automated or fully automated, then obtaining quality information on the volume and quantity of elements for the last stage of the final estimate - remains a bottleneck in the processes of all calculations of cost and time characteristics of the project.
Modern approaches to estimating and estimating involve automatically deriving volumetric and quantitative attributes from CAD (BIM) models on which additional layers of information are layered. In addition to 3D geometric attributes, entities are supplemented with 4D time attributes, and 5D attributes, including aspects related to cost.