Рисунок 3
048 Python Pandas an indispensable tool for working with data
10 June 2025
050 Next steps building a sustainable data framework
10 June 2025

049 DataFrame universal tabular data format

DataFrame is the central structure in the Pandas library, which is a two-dimensional table (Fig. 3.4-6) where rows correspond to individual objects or records and columns correspond to their characteristics, parameters, or categories. This structure visually resembles Excel spreadsheets, but is far superior in terms of flexibility, scalability, and functionality.

A DataFrame is a way to represent and process tabular data stored in the computer’s RAM.

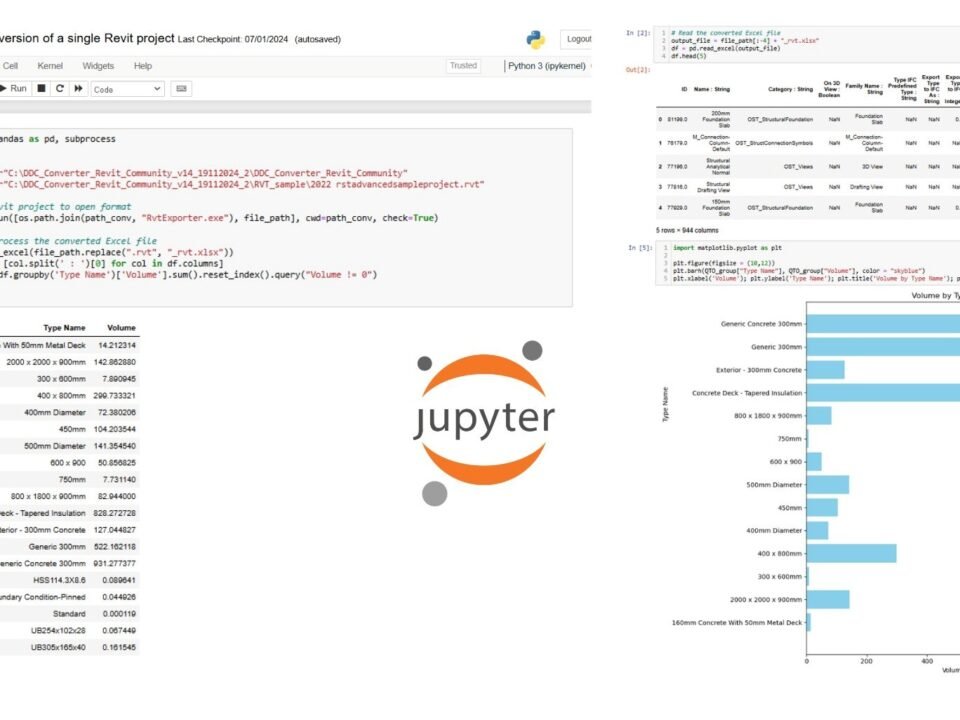
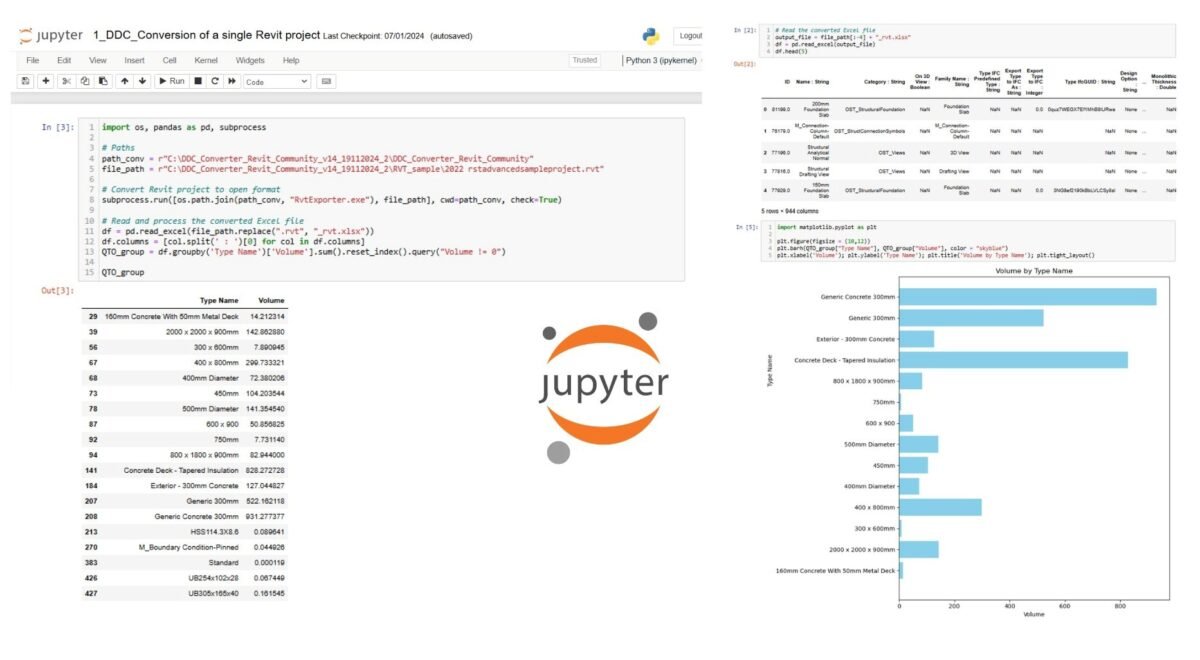
DataFrame is a way of representing and processing tabular data stored in the computer’s RAM. In a table, rows can reflect, for example, elements of a construction project, and columns – their properties: categories, dimensions, coordinates, cost, terms and so on. Moreover, such a table can contain both information on one project (Fig. 4.1-13) and data on millions of objects from thousands of different projects (Fig. 9.1-10). Thanks to vectorized Pandas operations, it is easy to filter, group and aggregate such volumes of information at high speed.

image163
Fig. 3.4-6 Construction Project as a DataFrame is a two-dimensional table with elements in rows and attributes in columns.

Nvidia estimates that already today up to 30% of all computing resources are used to process structured data – dataframes, and this share continues to grow.

Data processing is what probably one third of the world’s computing is done in every company. The data processing and data of most companies are in DataFrame, in table format

– Jensen Huang, CEO of Nvidia (“NVIDIA CEO Jensen Huang Keynote at COMPUTEX 2024,” June 2, 2024)

Let’s list some key features of DataFrame in Pandas:

  • Columns: in DataFrame, data is organized into columns, each with a unique name. Attribute columns can contain data of different types, similar to columns in databases or columns in tables.
  • Pandas Series is a one-dimensional data structure in Pandas, similar to a list or column in a table, where each value corresponds to a different index

Pandas Series has over 400 attributes and methods, making working with data incredibly flexible. You can directly apply one of the four hundred available functions to a column, perform math operations, filter data, replace values, work with dates, strings, and more. In addition, Series supports vectorized operations, which greatly speeds up the processing of large datasets compared to cyclic calculations. For example, you can easily multiply all values by a number, replace missing data, or apply complex transformations without writing complicated loops.

  • Rows: in DataFrame can be indexed with unique values. This index allows you to quickly change and adjust the data in specific rows.
  • Index: By default, when you create a DataFrame Pandas assigns each row an index from 0 to N-1 (where N is the number of all rows in the DataFrame). However, the index can be changed to include special designations such as dates or unique characteristics.
  • Indexing rows in a DataFrame means that each row is assigned a unique name or label, which is called the DataFrame index.
  • Data Types: DataFrame supports a variety of data types, including: int, float, bool, datetime64 and obect for text data. Each DataFrame column has its own data type that determines what operations can be performed on its contents.
  • Data operations: DataFrame supports a wide range of operations for data processing, including aggregation (groupby), merge (merge and join), concatenation (concat), split-apply-combine, and many other data transformation techniques.
  • Size Manipulation: DataFrame allows you to add and remove columns and rows, making it a dynamic structure that can be modified according to your data analysis needs.
  • Visualizing data: using built-in visualization techniques or interacting with popular data visualization libraries such as Matplotlib or Seaborn, DataFrame can be easily converted to graphs and charts to present data graphically.
  • Data input and output: Pandas provides functions to read import and export data to various file formats such as CSV, Excel, JSON, HTML and SQL, potentially making DataFrame a central hub for data collection and distribution.

Unlike CSV and XLSX, Pandas DataFrame provides greater flexibility and performance when working with data: it can handle large amounts of information in RAM, supports extended data types (including dates, logical values, and time series), and provides extensive capabilities for filtering, aggregating, merging, and visualizing data. While CSV does not store information about data types and structure, and XLSX is often overloaded with formatting and has low scalability, DataFrame remains the optimal choice for rapid analytics, process automation, and integration with AI -models (Fig. 3.4-7). In the following chapters we will explore each of these aspects of data in detail, also in Part 8 of the book, similar formats such as Parquet, Apache Orc, JSON, Feather, HDF5 and data warehouses will be discussed in detail (Fig. 8.1-2).

Picture 1
Fig. 3.4-7 DataFrame is the optimal choice of data manipulation with high performance and advanced data type support.

Because of their flexibility, power, and ease of use, the Pandas library and DataFrame format have become the de facto standard in Python data analysis. They are ideal for both creating simple reports and building complex analytic pipelines, especially in conjunction with LLM models.

Рисунок 5
Fig. 3.4-8 LLMs simplify interaction with Pandas: a text query is sufficient instead of code.

Today Pandas is actively used in LLM-based chat rooms such as ChatGPT, LlaMa, DeepSeek, QWEN and others. In many cases, when a model receives a query related to table processing, data validation or analytics, it generates code exactly using the Pandas library. This makes DataFrame a natural “language” for representing data in AI dialogs (Fig. 3.4-8).

Modern data technologies such as Pandas make it easier to analyze, automate and integrate data into business processes. They deliver results quickly, reduce the workload of specialists, and ensure repeatable operations.

.

Change language

Post's Highlights

Stay updated: news and insights


We’re Here to Help

Fresh solutions are released through our social channels

Leave a Reply

Your email address will not be published. Required fields are marked *

Focus Areas

navigate
  • ALL THE CHAPTERS IN THIS PART
  • A PRACTICAL GUIDE TO IMPLEMENTING A DATA-DRIVEN APPROACH (8)
  • CLASSIFICATION AND INTEGRATION: A COMMON LANGUAGE FOR CONSTRUCTION DATA (8)
  • DATA FLOW WITHOUT MANUAL EFFORT: WHY ETL (8)
  • DATA INFRASTRUCTURE: FROM STORAGE FORMATS TO DIGITAL REPOSITORIES (8)
  • DATA UNIFICATION AND STRUCTURING (7)
  • SYSTEMATIZATION OF REQUIREMENTS AND VALIDATION OF INFORMATION (7)
  • COST CALCULATIONS AND ESTIMATES FOR CONSTRUCTION PROJECTS (6)
  • EMERGENCE OF BIM-CONCEPTS IN THE CONSTRUCTION INDUSTRY (6)
  • MACHINE LEARNING AND PREDICTIONS (6)
  • BIG DATA AND ITS ANALYSIS (5)
  • DATA ANALYTICS AND DATA-DRIVEN DECISION-MAKING (5)
  • DATA CONVERSION INTO A STRUCTURED FORM (5)
  • DESIGN PARAMETERIZATION AND USE OF LLM FOR CAD OPERATION (5)
  • GEOMETRY IN CONSTRUCTION: FROM LINES TO CUBIC METERS (5)
  • LLM AND THEIR ROLE IN DATA PROCESSING AND BUSINESS PROCESSES (5)
  • ORCHESTRATION OF ETL AND WORKFLOWS: PRACTICAL SOLUTIONS (5)
  • SURVIVAL STRATEGIES: BUILDING COMPETITIVE ADVANTAGE (5)
  • 4D-6D and Calculation of Carbon Dioxide Emissions (4)
  • CONSTRUCTION ERP AND PMIS SYSTEMS (4)
  • COST AND SCHEDULE FORECASTING USING MACHINE LEARNING (4)
  • DATA WAREHOUSE MANAGEMENT AND CHAOS PREVENTION (4)
  • EVOLUTION OF DATA USE IN THE CONSTRUCTION INDUSTRY (4)
  • IDE WITH LLM SUPPORT AND FUTURE PROGRAMMING CHANGES (4)
  • QUANTITY TAKE-OFF AND AUTOMATIC CREATION OF ESTIMATES AND SCHEDULES (4)
  • THE DIGITAL REVOLUTION AND THE EXPLOSION OF DATA (4)
  • Uncategorized (4)
  • CLOSED PROJECT FORMATS AND INTEROPERABILITY ISSUES (3)
  • MANAGEMENT SYSTEMS IN CONSTRUCTION (3)
  • AUTOMATIC ETL CONVEYOR (PIPELINE) (2)

Search

Search

057 Speed of decision making depends on data quality

Today’s design data architecture is undergoing fundamental changes. The industry is moving away from bulky, isolated models and closed formats towards more flexible, machine-readable structures focused on analytics, integration and process automation. However, the transition...

060 A common language of construction the role of classifiers in digital transformation

In the context of digitalization and automation of inspection and processing processes, a special role is played by classification systems elements – a kind of “digital dictionaries” that ensure uniformity in the description and parameterization...

061 Masterformat, OmniClass, Uniclass and CoClass the evolution of classification systems

Historically, construction element and work classifiers have evolved in three generations, each reflecting the level of available technology and the current needs of the industry in a particular time period (Fig. 4.2-8): First generation (early...

Don't miss the new solutions


Linux

macOS

Looking for the Linux or MAC version? Send us a quick message using the button below, and we’ll guide you through the process!


📥 Download OnePager

Welcome to DataDrivenConstruction—where data meets innovation in the construction industry. Our One-Pager offers a concise overview of how our data-driven solutions can transform your projects, enhance efficiency, and drive sustainable growth. 

🚀 Welcome to the future of data in construction!

You're taking your first step into the world of open data, working with normalized, structured data—the foundation of data analytics and modern automation tools.

By downloading, you agree to the DataDrivenConstruction terms of use 

Stay ahead with the latest updates on converters, tools, AI, LLM
and data analytics in construction — Subscribe now!

🚀 Welcome to the future of data in construction!

You're taking your first step into the world of open data, working with normalized, structured data—the foundation of data analytics and modern automation tools.

By downloading, you agree to the DataDrivenConstruction terms of use 

Stay ahead with the latest updates on converters, tools, AI, LLM
and data analytics in construction — Subscribe now!

🚀 Welcome to the future of data in construction!

You're taking your first step into the world of open data, working with normalized, structured data—the foundation of data analytics and modern automation tools.

By downloading, you agree to the DDC terms of use 

🚀 Welcome to the future of data in construction!

You're taking your first step into the world of open data, working with normalized, structured data—the foundation of data analytics and modern automation tools.

By downloading, you agree to the DataDrivenConstruction terms of use 

Stay ahead with the latest updates on converters, tools, AI, LLM
and data analytics in construction — Subscribe now!

DataDrivenConstruction offers workshops tested and practiced on global leaders in the construction industry to help your team navigate and leverage the power of data and artificial intelligence in your company's decision making.

Reserve your spot now to rethink your
approach to decision making!

Please enable JavaScript in your browser to complete this form.


🚀 Welcome to the future of data in construction!

By downloading, you agree to the DataDrivenConstruction terms of use 

Stay ahead with the latest updates on converters, tools, AI, LLM
and data analytics in construction — Subscribe now!

Have a question or need more information? Reach out to us directly!
Schedule a time to discuss your needs with our team.
Tailored sessions to help your team grow — let's plan together!
Have you attended one of our workshops, read our book, or used our solutions? Share your thoughts with us!
Please enable JavaScript in your browser to complete this form.
Name
Data Maturity Diagnostics

🧰 Data-Driven Readiness Check

This short assessment will help you identify your company's data management pain points and offer solutions to improve project efficiency. It takes only 1–2 minutes to complete and you will receive personalized recommendations tailored to your needs.

🚀 Goals and Pain Points

What are your biggest obstacles today — and your goals for the next 6 months? We’ll use your answers to build a personalized roadmap.

Build your automation pipeline

 Understand and organize your data

Automate your key process

Define a digital strategy

Move from CAD (BIM) to databases and analytics

Combine BIM, ERP and Excel

Convince leadership to invest in data

📘  What to Read in Data-Driven Construction Guidebook

Chapters 1.2, 4.1–4.3 – Technologies, Data Conversion, Structuring, Modeling:

  • Centralized vs fragmented data

  • Principles of data structure

  • Roles of Excel, DWH, and databases

Chapters 5.2, 7.2 – QTO Automation, ETL with Python:

  • Data filtering and grouping

  • Automating QTO and quantity takeoff

  • Python scripts and ETL logic

Chapter 10.2 – Roadmap for Digital Transformation:

  • Strategic stages of digital change

  • Organizational setup

  • Prioritization and execution paths

Chapters 4.1, 8.1–8.2 – From CAD (BIM) to Storage & Analytics:

  • Translating Revit/IFC to structured tables

  • BIM as a database

  • Building analytical backends

Chapters 7.3, 10.2 – Building ETL Pipelines + Strategic Integration:

  • Combining Excel, BIM, ERP

  • Automating flows between tools

  • Connecting scattered data sources

Chapters 7.3, 7.4 – ETL Pipelines and Orchestration (Airflow, n8n):

  • Building pipelines

  • Scheduling jobs

  • Using tools like Airflow or n8n to control the flow 

Chapters 2.1, 10.1 – Fragmentation, ROI, Survival Strategy:

  • Hidden costs of bad data

  • Risk of inaction

  • ROI of data initiatives

  • Convincing stakeholders

Download the DDC Guidebook for Free


🎯 DDC Workshop That Solves Your Puzzle

Module 1 – Data Automation and Workflows in Construction:
  • Overview of data sources
  • Excel vs systems
  • Typical data flows in construction
  • Foundational data logic

Module 3 – Automated Data Processing Workflow:
  • Setting up ETL workflows
  • CAD/BIM extraction
  • Automation in Excel/PDF reporting

Module 8 – Converting Unstructured CAD into Structured Formats 
  • From IFC/Revit to tables
  • Geometric vs semantic data
  • Tools for parsing and transforming CAD models

Module 13 – Key Stages of Transformation 
  • Transformation roadmap
  • Change management
  • Roles and responsibilities
  • KPIs and success metrics

Module 8 – Integrating Diverse Data Systems and Formats
  • Excel, ERP, BIM integration
  • Data connection and file exchange
  • Structuring hybrid pipelines

Module 7 – Automating Data Quality Assurance Processes 
  • Rules and checks
  • Dashboards
  • Report validation
  • Automated exception handling

Module 10 – Challenges of Digitalization in the Industry 
  • How to justify investment in data
  • Stakeholder concerns
  • ROI examples
  • Failure risks

💬 Individual Consultation – What We'll Discuss

Audit of your data landscape 

We'll review how data is stored and shared in your company and identify key improvement areas.

Select a process for automation 

We'll pick one process in your company that can be automated and outline a step-by-step plan.

Strategic roadmap planning 

Together we’ll map your digital transformation priorities and build a realistic roadmap.

CAD (BIM) - IFC/Revit model review 

We'll review your Revit/IFC/DWG data and show how to convert it into clean, structured datasets.

Mapping integrations across tools 

We’ll identify your main data sources and define how they could be connected into one workflow.

Plan a pilot pipeline (PoC) 

We'll plan a pilot pipeline: where to start, what tools to use, and what benefits to expect.

ROI and stakeholder alignment 

📬 Get Your Personalized Report and Next Steps

You’ve just taken the first step toward clarity. But here’s the uncomfortable truth: 🚨 Most companies lose time and money every week because they don't know what their data is hiding. Missed deadlines, incorrect reports, disconnected teams — all symptoms of a silent data chaos that gets worse the longer it's ignored.

Please enter your contact details so we can send you your customized recommendations and next-step options tailored to your goals.

💡 What you’ll get next:

  • A tailored action plan based on your answers

  • A list of tools and strategies to fix what’s slowing you down

  • An invite to a free 1:1 session to discuss your case

  • And if you choose: a prototype (PoC) to show how your process could be automated — fast.

049 DataFrame universal tabular data format
This website uses cookies to improve your experience. By using this website you agree to our Data Protection Policy.
Read more
×