image177
069 Data collection for the verification process
10 June 2025
image69
071 Visualization of verification results
10 June 2025

070 Verification of data and results of verification

All new data entering the system – be it documents, tables or database entries from the client, architect, engineer, foreman, logistician or property manager – must be validated against the requirements formulated earlier (Fig. 4.4-9). The validation process is critical: any errors in the data can lead to incorrect calculations, schedule delays, and even financial losses. To minimize such risks, it is necessary to organize a systematic and repeatable, iterative data validation procedure.

To validate new data entering the system – unstructured, textual or geometric – it must be converted into a loosely structured or structured format. The validation process must then check the data against the full list of required attributes and their allowed values.

Converting different types of data: text, images, PDF -documents and mixed CAD (BIM) data into a structured form was discussed in detail in the chapter “Converting data into a structured form”.

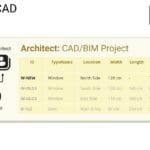
An example is a table obtained from CAD (BIM) of a project (Fig. 4.4-11). It includes semi-structured geometric data and structured attribute information on project entities (Fig. 3.1-14) – for example an element from the class “Windows”.

To perform the validation, we compare the attribute values (Fig. 4.4-11) with the reference boundary values that were defined by experts in the form of a requirement (Fig. 4.4-9). The final comparison table (Fig. 4.4-13) will allow us to understand which values are acceptable and which ones need to be corrected before the data can be used outside of CAD applications (BIM).

image100
Fig. 4.4-13 The final validation table highlights those attribute values for the new entity of class Windowsthat you should pay attention to.

Implementing a similar solution using the Pandas library, which we described earlier in the chapter “Pandas: An Indispensable Tool for Data Analysis”, we will validate data from a tabular file extracted from a CAD file (BIM) (RVT, IFC, DWG, NWS, DGN) (Fig. 4.4-11) using requirements from another tabular requirements file (Fig. 4.4-9).

To get the code, we need to describe in the prompt for LLM that we need to load the data from the file raw_data.xlsx (a complete set of data from the CAD database (BIM)), check them and save the result in a new file checked_data.xlsx (Fig. 4.4-13).

  • Let’s get the code using LLM without mentioning the Pandas library:

    Write code to check the table from the raw_data.xlsx file and validate them using the following validation rules: the values of the ‘Width’ and ‘Length’ columns are greater than zero, ‘Energy Rating’ is included in the [‘A++’, ‘A+’, ‘A’, ‘B’] list, and ‘Acoustic Performance’ as a variable that we’ll specify later – with the final validation column added, and save the final table to a new Excel file checked_data.xlsx

  • LLM’s response will describe a short example of Python code that can be refined and augmented by subsequent prompts:
image26
Fig. 4.4-14 The code generated by the LLM- model checks the converted CAD (BIM) design against the attribute requirements in the form of boundary values.

The code generated by the LLM language model, can be used in any popular IDE or online tool: PyCharm, Visual Studio Code (VS Code), Jupyter Notebook, Spyder, Atom, Sublime Text, Eclipse with PyDev plugin, Thonny, Wing IDE, IntelliJ IDEA with Python plugin, JupyterLab or popular online tools Kaggle.com, Google Collab, Microsoft Azure Notebooks, Amazon SageMaker.

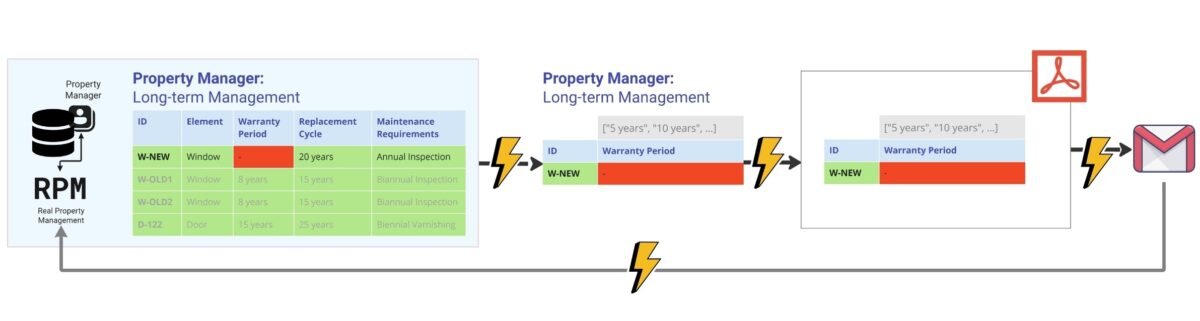
Execution of the code (Fig. 4.4-14) will show that the “entity elements” W-OLD1, W-OLD2, D-122 (and other elements) from the CAD database (BIM) meet the attribute requirements: width and length are greater than zero, and the energy efficiency class is one of the list values ‘A++’, ‘A’, ‘B’, ‘C’ (Fig. 4.4-15).

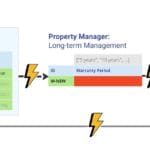
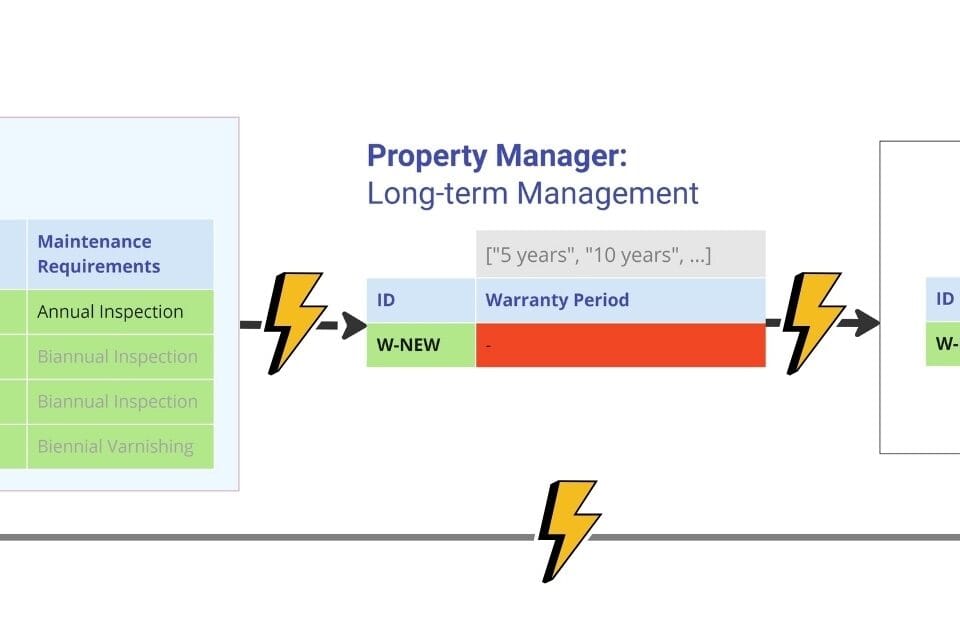
The W-NEW element we need and recently added, which is responsible for the new element class “Window” on the north side, is not compliant (attribute “Requrments Met”) because its length is zero (a value of “0.0” is considered unacceptable by our ‘Width’>0 rule) and it does not specify an energy efficiency class.

.

image173
Fig. 4.4-15 Checking identifies entities that have not gone through the verification process and adds a new attribute with values ‘False’ or ‘True’ to the results.

Similarly, we check the consistency of all project elements (entities) and required attributes for each of the systems, tables or databases in all the data we receive from different specialists (Fig. 4.4-1) during the process of adding a window to the project.

In the final table it is convenient to highlight the results of the check by color for visualization: attributes that successfully passed the check are marked in green, yellow – values with non-critical deviations, and red – critical inconsistencies (Fig. 4.4-16).

As a result of the validation (Fig. 4.4-16), we get a list of trusted and validated elements with their IDs that have been verified to meet attribute requirements. Validated elements provide assurance that these elements meet the stated standards and specifications for all systems involved in the process of adding elements of the Window class or any other class (we will talk more about automating data validation and creating an automated ETL process in the chapter “Automating ETL and Data Validation”).

.

image7
Fig. 4.4-16 The result of the check performed for all systems allows to determine which data does not meet the company’s requirements.

Entities that have been successfully validated usually do not require much attention. They move on to the next stages of processing and integration into other systems without obstacles. In contrast to “quality” items, it is the items that fail validation that are of greatest interest. Information about such deviations is critical: it should be communicated not only in the form of tabular reports, but also using various visualization tools. Graphical representation of inspection results helps to quickly assess the overall state of data quality, identify problem areas and promptly take measures to correct or refine parameters.

.

Change language

Post's Highlights

Stay updated: news and insights


We’re Here to Help

Fresh solutions are released through our social channels

Leave a Reply

Your email address will not be published. Required fields are marked *

Focus Areas

navigate
  • ALL THE CHAPTERS IN THIS PART
  • A PRACTICAL GUIDE TO IMPLEMENTING A DATA-DRIVEN APPROACH (8)
  • CLASSIFICATION AND INTEGRATION: A COMMON LANGUAGE FOR CONSTRUCTION DATA (8)
  • DATA FLOW WITHOUT MANUAL EFFORT: WHY ETL (8)
  • DATA INFRASTRUCTURE: FROM STORAGE FORMATS TO DIGITAL REPOSITORIES (8)
  • DATA UNIFICATION AND STRUCTURING (7)
  • SYSTEMATIZATION OF REQUIREMENTS AND VALIDATION OF INFORMATION (7)
  • COST CALCULATIONS AND ESTIMATES FOR CONSTRUCTION PROJECTS (6)
  • EMERGENCE OF BIM-CONCEPTS IN THE CONSTRUCTION INDUSTRY (6)
  • MACHINE LEARNING AND PREDICTIONS (6)
  • BIG DATA AND ITS ANALYSIS (5)
  • DATA ANALYTICS AND DATA-DRIVEN DECISION-MAKING (5)
  • DATA CONVERSION INTO A STRUCTURED FORM (5)
  • DESIGN PARAMETERIZATION AND USE OF LLM FOR CAD OPERATION (5)
  • GEOMETRY IN CONSTRUCTION: FROM LINES TO CUBIC METERS (5)
  • LLM AND THEIR ROLE IN DATA PROCESSING AND BUSINESS PROCESSES (5)
  • ORCHESTRATION OF ETL AND WORKFLOWS: PRACTICAL SOLUTIONS (5)
  • SURVIVAL STRATEGIES: BUILDING COMPETITIVE ADVANTAGE (5)
  • 4D-6D and Calculation of Carbon Dioxide Emissions (4)
  • CONSTRUCTION ERP AND PMIS SYSTEMS (4)
  • COST AND SCHEDULE FORECASTING USING MACHINE LEARNING (4)
  • DATA WAREHOUSE MANAGEMENT AND CHAOS PREVENTION (4)
  • EVOLUTION OF DATA USE IN THE CONSTRUCTION INDUSTRY (4)
  • IDE WITH LLM SUPPORT AND FUTURE PROGRAMMING CHANGES (4)
  • QUANTITY TAKE-OFF AND AUTOMATIC CREATION OF ESTIMATES AND SCHEDULES (4)
  • THE DIGITAL REVOLUTION AND THE EXPLOSION OF DATA (4)
  • Uncategorized (4)
  • CLOSED PROJECT FORMATS AND INTEROPERABILITY ISSUES (3)
  • MANAGEMENT SYSTEMS IN CONSTRUCTION (3)
  • AUTOMATIC ETL CONVEYOR (PIPELINE) (2)

Search

Search

057 Speed of decision making depends on data quality

Today’s design data architecture is undergoing fundamental changes. The industry is moving away from bulky, isolated models and closed formats towards more flexible, machine-readable structures focused on analytics, integration and process automation. However, the transition...

060 A common language of construction the role of classifiers in digital transformation

In the context of digitalization and automation of inspection and processing processes, a special role is played by classification systems elements – a kind of “digital dictionaries” that ensure uniformity in the description and parameterization...

061 Masterformat, OmniClass, Uniclass and CoClass the evolution of classification systems

Historically, construction element and work classifiers have evolved in three generations, each reflecting the level of available technology and the current needs of the industry in a particular time period (Fig. 4.2-8): First generation (early...

Don't miss the new solutions


Linux

macOS

Looking for the Linux or MAC version? Send us a quick message using the button below, and we’ll guide you through the process!


📥 Download OnePager

Welcome to DataDrivenConstruction—where data meets innovation in the construction industry. Our One-Pager offers a concise overview of how our data-driven solutions can transform your projects, enhance efficiency, and drive sustainable growth. 

🚀 Welcome to the future of data in construction!

You're taking your first step into the world of open data, working with normalized, structured data—the foundation of data analytics and modern automation tools.

By downloading, you agree to the DataDrivenConstruction terms of use 

Stay ahead with the latest updates on converters, tools, AI, LLM
and data analytics in construction — Subscribe now!

🚀 Welcome to the future of data in construction!

You're taking your first step into the world of open data, working with normalized, structured data—the foundation of data analytics and modern automation tools.

By downloading, you agree to the DataDrivenConstruction terms of use 

Stay ahead with the latest updates on converters, tools, AI, LLM
and data analytics in construction — Subscribe now!

🚀 Welcome to the future of data in construction!

You're taking your first step into the world of open data, working with normalized, structured data—the foundation of data analytics and modern automation tools.

By downloading, you agree to the DDC terms of use 

🚀 Welcome to the future of data in construction!

You're taking your first step into the world of open data, working with normalized, structured data—the foundation of data analytics and modern automation tools.

By downloading, you agree to the DataDrivenConstruction terms of use 

Stay ahead with the latest updates on converters, tools, AI, LLM
and data analytics in construction — Subscribe now!

DataDrivenConstruction offers workshops tested and practiced on global leaders in the construction industry to help your team navigate and leverage the power of data and artificial intelligence in your company's decision making.

Reserve your spot now to rethink your
approach to decision making!

Please enable JavaScript in your browser to complete this form.


🚀 Welcome to the future of data in construction!

By downloading, you agree to the DataDrivenConstruction terms of use 

Stay ahead with the latest updates on converters, tools, AI, LLM
and data analytics in construction — Subscribe now!

Have a question or need more information? Reach out to us directly!
Schedule a time to discuss your needs with our team.
Tailored sessions to help your team grow — let's plan together!
Have you attended one of our workshops, read our book, or used our solutions? Share your thoughts with us!
Please enable JavaScript in your browser to complete this form.
Name
Data Maturity Diagnostics

🧰 Data-Driven Readiness Check

This short assessment will help you identify your company's data management pain points and offer solutions to improve project efficiency. It takes only 1–2 minutes to complete and you will receive personalized recommendations tailored to your needs.

🚀 Goals and Pain Points

What are your biggest obstacles today — and your goals for the next 6 months? We’ll use your answers to build a personalized roadmap.

Build your automation pipeline

 Understand and organize your data

Automate your key process

Define a digital strategy

Move from CAD (BIM) to databases and analytics

Combine BIM, ERP and Excel

Convince leadership to invest in data

📘  What to Read in Data-Driven Construction Guidebook

Chapters 1.2, 4.1–4.3 – Technologies, Data Conversion, Structuring, Modeling:

  • Centralized vs fragmented data

  • Principles of data structure

  • Roles of Excel, DWH, and databases

Chapters 5.2, 7.2 – QTO Automation, ETL with Python:

  • Data filtering and grouping

  • Automating QTO and quantity takeoff

  • Python scripts and ETL logic

Chapter 10.2 – Roadmap for Digital Transformation:

  • Strategic stages of digital change

  • Organizational setup

  • Prioritization and execution paths

Chapters 4.1, 8.1–8.2 – From CAD (BIM) to Storage & Analytics:

  • Translating Revit/IFC to structured tables

  • BIM as a database

  • Building analytical backends

Chapters 7.3, 10.2 – Building ETL Pipelines + Strategic Integration:

  • Combining Excel, BIM, ERP

  • Automating flows between tools

  • Connecting scattered data sources

Chapters 7.3, 7.4 – ETL Pipelines and Orchestration (Airflow, n8n):

  • Building pipelines

  • Scheduling jobs

  • Using tools like Airflow or n8n to control the flow 

Chapters 2.1, 10.1 – Fragmentation, ROI, Survival Strategy:

  • Hidden costs of bad data

  • Risk of inaction

  • ROI of data initiatives

  • Convincing stakeholders

Download the DDC Guidebook for Free


🎯 DDC Workshop That Solves Your Puzzle

Module 1 – Data Automation and Workflows in Construction:
  • Overview of data sources
  • Excel vs systems
  • Typical data flows in construction
  • Foundational data logic

Module 3 – Automated Data Processing Workflow:
  • Setting up ETL workflows
  • CAD/BIM extraction
  • Automation in Excel/PDF reporting

Module 8 – Converting Unstructured CAD into Structured Formats 
  • From IFC/Revit to tables
  • Geometric vs semantic data
  • Tools for parsing and transforming CAD models

Module 13 – Key Stages of Transformation 
  • Transformation roadmap
  • Change management
  • Roles and responsibilities
  • KPIs and success metrics

Module 8 – Integrating Diverse Data Systems and Formats
  • Excel, ERP, BIM integration
  • Data connection and file exchange
  • Structuring hybrid pipelines

Module 7 – Automating Data Quality Assurance Processes 
  • Rules and checks
  • Dashboards
  • Report validation
  • Automated exception handling

Module 10 – Challenges of Digitalization in the Industry 
  • How to justify investment in data
  • Stakeholder concerns
  • ROI examples
  • Failure risks

💬 Individual Consultation – What We'll Discuss

Audit of your data landscape 

We'll review how data is stored and shared in your company and identify key improvement areas.

Select a process for automation 

We'll pick one process in your company that can be automated and outline a step-by-step plan.

Strategic roadmap planning 

Together we’ll map your digital transformation priorities and build a realistic roadmap.

CAD (BIM) - IFC/Revit model review 

We'll review your Revit/IFC/DWG data and show how to convert it into clean, structured datasets.

Mapping integrations across tools 

We’ll identify your main data sources and define how they could be connected into one workflow.

Plan a pilot pipeline (PoC) 

We'll plan a pilot pipeline: where to start, what tools to use, and what benefits to expect.

ROI and stakeholder alignment 

📬 Get Your Personalized Report and Next Steps

You’ve just taken the first step toward clarity. But here’s the uncomfortable truth: 🚨 Most companies lose time and money every week because they don't know what their data is hiding. Missed deadlines, incorrect reports, disconnected teams — all symptoms of a silent data chaos that gets worse the longer it's ignored.

Please enter your contact details so we can send you your customized recommendations and next-step options tailored to your goals.

💡 What you’ll get next:

  • A tailored action plan based on your answers

  • A list of tools and strategies to fix what’s slowing you down

  • An invite to a free 1:1 session to discuss your case

  • And if you choose: a prototype (PoC) to show how your process could be automated — fast.

070 Verification of data and results of verification
This website uses cookies to improve your experience. By using this website you agree to our Data Protection Policy.
Read more
×