
In real construction projects, it is often necessary to perform aggregation by several attributes simultaneously within one group of elements. For example, when working with the category “Windows” (where the Category attribute contains values like OST_Windows or IfcWindows), elements can be grouped not only by type – for example, by the value in the Type Name or Type field – but also by additional characteristics, such as the thermal conductivity level specified in the corresponding attribute. Such multidimensional grouping allows for more accurate results for a particular group. Similarly, when calculating wall or floor categories, arbitrary combinations of attributes – such as material, level, floor, fire resistance, and other parameters – can be used as filters or grouping criteria (Fig. 5.2-9).

The process of defining such grouping rules is similar to the process of creating data requirements described in the chapter “Creating Requirements and Quality Checking data ” (Fig. 4.4-5), where we discussed working with data models in detail. These grouping and calculation rules ensure the accuracy and relevance of the results to automatically calculate the total attributes of the quantity or volume of an entity category, taking into account all the necessary conditions that must be taken into account in calculations and calculations.
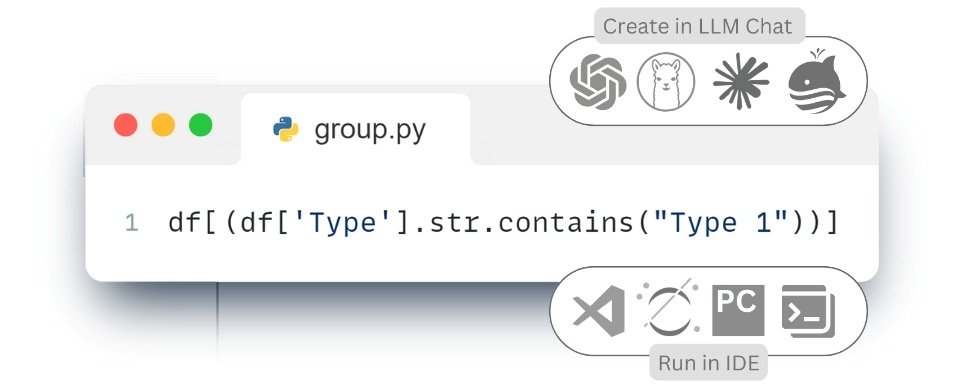
- The following code sample filters the projects table so that the resulting dataset contains only entities in which the “Category” attribute-column contains the values “OST_Windows” or “IfcWindows” and at the same time the “Type” attribute-column contains the value “Type 1”:
I have a DataFrame project – filter the data so that only items that have the attribute “Category” containing the values “OST_Windows” or “IfcWindows” and at the same time the Type attribute contains the value “Type 1remain in the dataset ⏎
 |
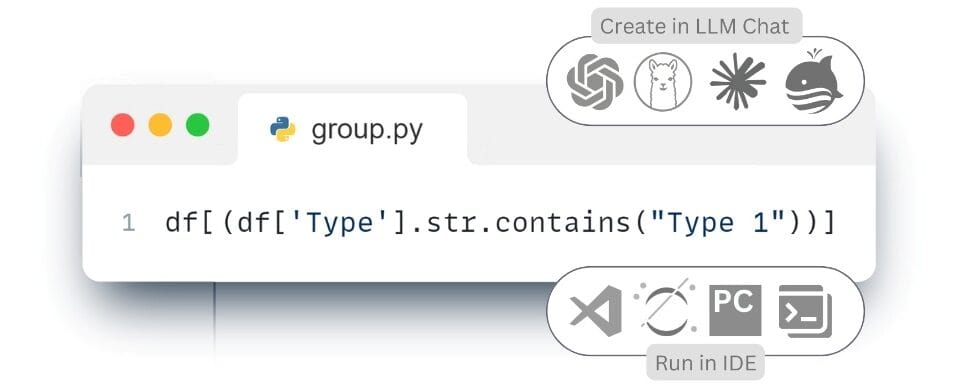
The resulting code (Fig. 5.2-10) after translation of CAD data in structured open formats (Fig. 4.1-13) can be run in one of the popular IDEs (integrated development environments) we mentioned above in offline mode: PyCharm, Visual Studio Code (VS Code), Jupyter Notebook, Spyder, Atom, Sublime Text, Eclipse with PyDev plugin, Thonny, Wing IDE, IntelliJ IDEA with Python plugin, JupyterLab or popular online tools: Kaggle.com, Google Collab, Microsoft Azure Notebooks, Amazon SageMaker.
- To retrieve the project entities in the QTO DataFrame form under the category “Windows” only with a specific thermal conductivity value, we can use the following query to the LLM:
I have a DataFrame project – filter the data so that only records with “Category” containing “OST_Windows” or “IfcWindows” values remain in the dataset, and at the same time the ThermalConductivity column should have a value of 0.⏎
 |
In the response received from LLM (Fig. 5.2-11), the logical condition “&” is used to combine two criteria: thermal conductivity value and belonging to one of the two categories. The “isin” method checks whether the value of the attribute-column “Category” is contained in the provided list.
In projects with a large number of element groups, with different grouping logic – for each category of project entities (e.g.: windows, doors, slabs) it is necessary to set individual grouping rules, which may include additional coefficients or total attribute calculation formulas. These formulas (Fig. 5.2-12 attribute “formel”, e.g. x-value of quantity and y-volume of group) and coefficients take into account the unique characteristics of each group, for example:
- add% to material volume to account for overruns
- fixed additional quantity of material
- adjustments related to possible risks and calculation errors in the form of formulas
Once the filtering and grouping rules are formulated in the form of parameter formulas for each item category, they can be saved as a line-by-line table – for example, in Excel format (Fig. 5.2-12). By storing these rules in a structured form, the process of extracting, filtering and grouping project data can be fully automated. Instead of manually writing many separate queries, the system simply reads the parameter table and applies the appropriate rules to the model (the overall project dataframe (Fig. 4.1-13)), generating final QTO tables for each category of project elements.

The collected rules will allow you to group the entire project and perform all necessary calculations, including adjustments to volume attributes. As a result, the volumes are brought to the “real volume”, which is used for calculations and calculations, and not those that were originally at the design stage in the CAD model.
In the process of automatically creating QTO volume tables for the entire project, the application must go through all the categories of the grouping rules table, take the grouping attributes, group all project elements by them, and aggregate the volume attribute for that group, additionally multiplying it by a refining factor or coefficient.
Let’s ask LLM to write code for us for such a solution, where the code would have to load two tables, a table of grouping rules (Fig. 5.2-12) and a table of the project data itself (Fig. 4.1-13), and then apply the grouping rules, group the items according to the given rules, calculate the aggregated values and save the results to a new Excel file.
- Send a text request to the LLM chat:
I need code to read project data from file ‘basic_sample_project.xlsx’ and then rules from ‘Grouping_rules_QTO.xlsx’ by which to group all data by ‘Parameter 1’ and ‘Parameter 2’, aggregate ‘Aggregate Parameter’, filter by ‘Expression2’, perform calculations from ‘Formel1’ and save QTO table to ‘QTQ_table2.xlsx⏎
 |
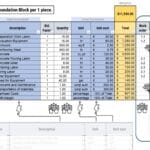
The final result of the code execution (Fig. 5.2-13) will be an entity-group table that contains not only the generalized volume attributes from the original CAD- (BIM-) model, but also a new real volume attribute that takes into account all the requirements for correct creation of calculations and estimates (Example Fig. 5.2-14).

The resulting code (Fig. 5.2-13) can be run in one of the popular IDEs (which we mentioned above) and applied to any number of existing or new incoming projects (RVT, IFC, DWG, NWS, DGN etc.), be it a few projects or perhaps hundreds of projects in different formats in a structured form (Fig. 5.2-15).

The customized and parameterized volumetric data collection process (Fig. 5.2-15) allows fully automated collection of data on quantitative attributes and volumes of project elements for further work with them, including cost estimation, logistics, work schedules and carbon footprint calculation and other analytical tasks.
Having learned tools that allow us to easily organize and group groups of project elements by specific attributes, we are now ready to integrate grouped and filtered projects with various company calculations and business scenarios.


