image60
156 Key concepts of machine learning
10 June 2025
Рисунок 2
158 Project cost and time prediction using linear regression
10 June 2025

157 An example of using machine learning to find project cost and schedule

Estimation of construction time and cost is one of the key processes in the activities of a construction company. Traditionally, such estimates are made by experts based on experience, reference books and regulatory databases. However, with digital transformation and increasing data availability, it is now possible to use machine learning (ML) models to improve the accuracy and automation of such estimates.

The introduction of machine learning into the process of calculating the cost and timing of construction not only makes it possible to increase the efficiency of planning, but also becomes a starting point for integrating intelligent models into other business processes – from risk management to optimizing logistics and procurement.

It is important to be able to quickly determine how long it will take to build a project and what its total cost will be. These questions about project time and cost have traditionally been at the forefront of the minds of both clients and construction companies since the birth of the construction industry.

image154
Fig. 9.3-1 In construction projects, the speed and quality of estimating construction time and cost are key success factors.

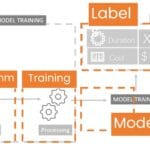
In the following example, key data from past projects will be extracted and used to develop a machine learning model, which will allow us to use the model to estimate the cost and timing of new construction projects with new parameters (Fig. 9.3-1).

Consider three projects with three key attributes: the number of apartments (where 100 apartments is equivalent to the number 10 for ease of visualization), the number of floors, and a conditional measure of construction complexity on a scale of 1 to 10, where 10 is the highest complexity score. In machine learning, the process of converting and simplifying values such as 100 to 10 or 50 to 5 is called “normalization”.

Normalization in machine learning is the process of bringing different numerical data to a common scale to facilitate its processing and analysis. This process is especially important when the data has different scales and units.

Suppose that the first project (Fig. 9.3-2) had 50 apartments (after normalization, 5), 7 floors and a complexity score of 2, which meant a relatively simple construction. The second project already had 80 apartments, 9 floors and a relatively complex project. Under these conditions, construction of the first and second apartment building took 270 and 330 days, and the total project cost was $4.5 million and $5.8 million, respectively.

image96
Fig. 9.3-2 An example of a set of past projects that will be used to estimate the time and cost of future project X.

When building a machine learning model for such data, the main task is to identify critical attributes (or labels) for prediction, in this case, construction time and cost. With a small dataset, we will use information about previous construction projects to plan new ones: using machine learning algorithms, we have to predict the construction cost and duration of a new project X based on given attributes of the new project, such as 40 apartments, 4 floors, and a relative high project complexity of 7 (Fig. 9.3-2). In a real-world setting, the number of input parameters can be much larger, ranging from several tens to hundreds of factors. These may include: type of construction materials, climatic zone, qualification level of contractors, availability of utilities, type of foundation, season of commencement of works, comments of foremen, etc.

To create a predictive machine learning model, we need to choose an algorithm to create it. An algorithm in machine learning is like a mathematical recipe that teaches the computer how to make predictions (mix in the right order of parameters) or make decisions based on data.

To analyze data on past construction projects and predict the timing and cost of future projects (Fig. 9.3-2), one popular machine learning algorithm can be used:

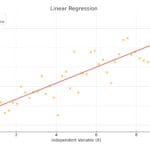
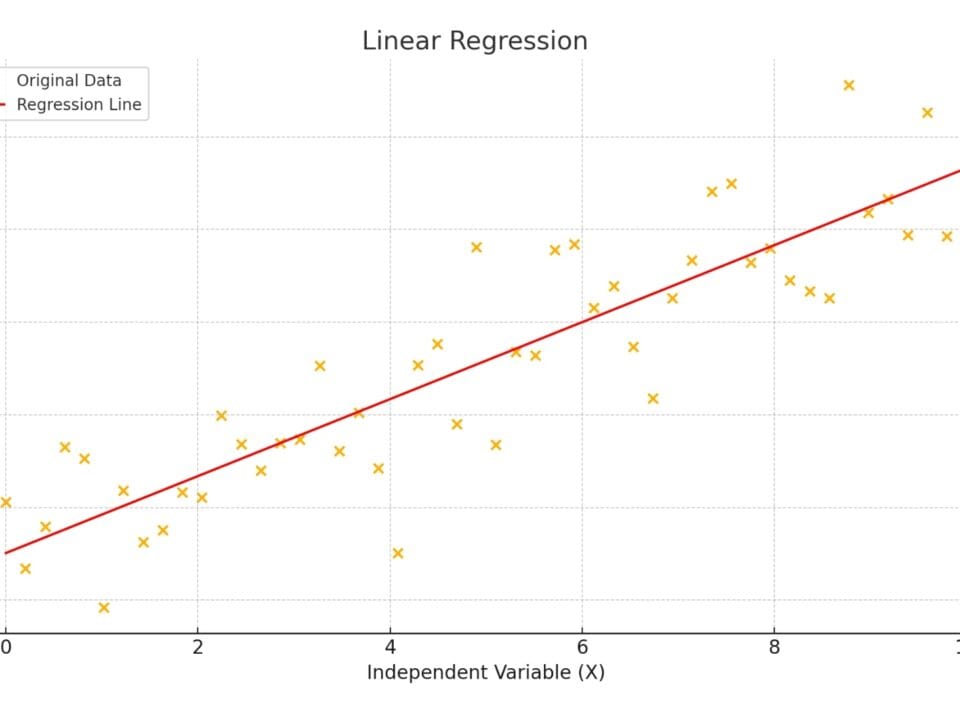
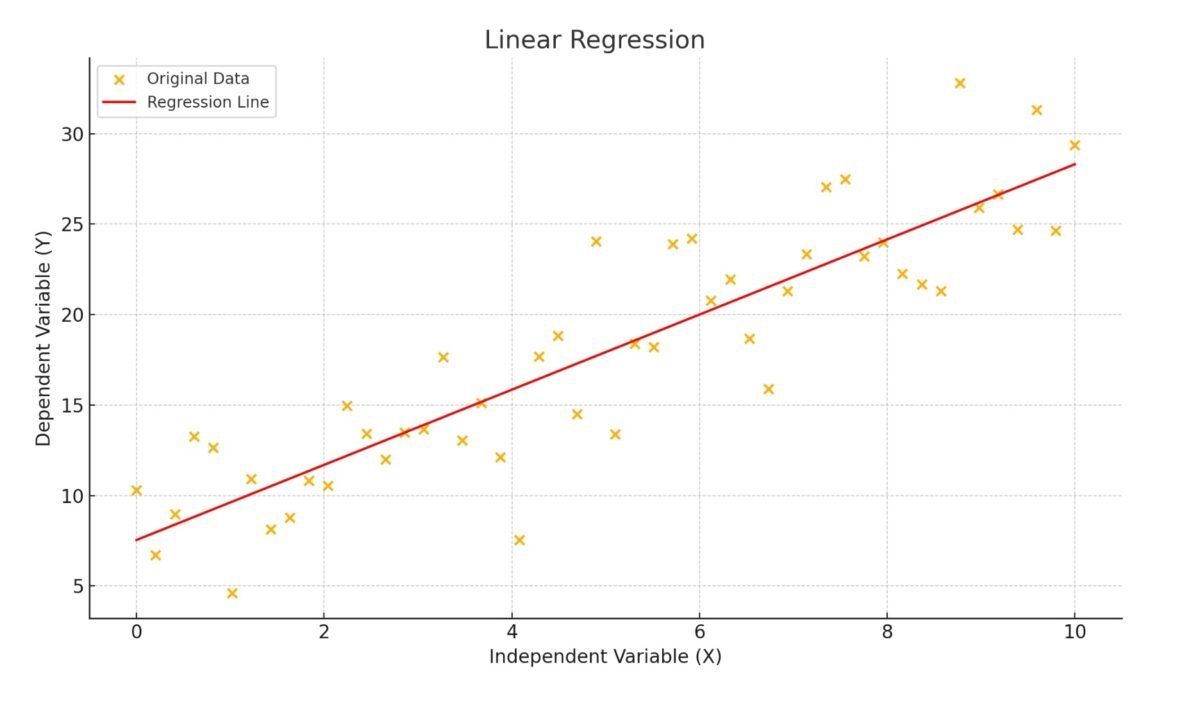
  • Linear regression (Linear regression): this algorithm tries to find a direct relationship between attributes, for example between the number of floors and the construction cost. The goal of the algorithm is to find a linear equation that best describes this relationship, which allows making predictions.
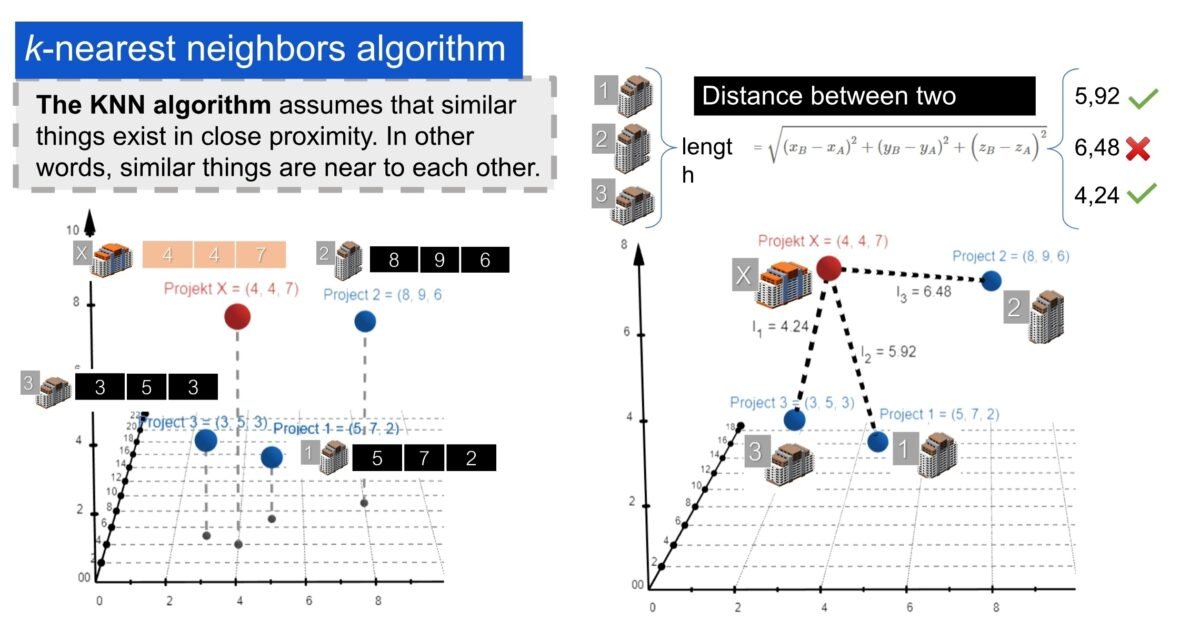
  • Algorithm k-nearest neighbors (k-NN): this algorithm compares a new project with past projects that were similar in size or complexity. The k-NN classifies the data based on which of the k (number) training examples are closest to it. In the context of regression, the result is the mean or median of the k nearest neighbors.
  • Decision Trees: is a predictive modeling model that divides data into subsets based on different conditions using a tree structure. Each node of the tree represents a condition or question leading to further division of the data, and each leaf represents the final prediction or outcome. The algorithm divides the data into smaller groups based on different characteristics, such as first by number of stories, then by complexity and so on, to make a prediction.

Let’s take a look at machine learning algorithms for estimating the cost of a new project using two popular algorithms as examples: linear regression and the K-nearest neighbors algorithm.

.

Change language

Post's Highlights

Stay updated: news and insights


We’re Here to Help

Fresh solutions are released through our social channels

Leave a Reply

Your email address will not be published. Required fields are marked *

Focus Areas

navigate
  • ALL THE CHAPTERS IN THIS PART
  • A PRACTICAL GUIDE TO IMPLEMENTING A DATA-DRIVEN APPROACH (8)
  • CLASSIFICATION AND INTEGRATION: A COMMON LANGUAGE FOR CONSTRUCTION DATA (8)
  • DATA FLOW WITHOUT MANUAL EFFORT: WHY ETL (8)
  • DATA INFRASTRUCTURE: FROM STORAGE FORMATS TO DIGITAL REPOSITORIES (8)
  • DATA UNIFICATION AND STRUCTURING (7)
  • SYSTEMATIZATION OF REQUIREMENTS AND VALIDATION OF INFORMATION (7)
  • COST CALCULATIONS AND ESTIMATES FOR CONSTRUCTION PROJECTS (6)
  • EMERGENCE OF BIM-CONCEPTS IN THE CONSTRUCTION INDUSTRY (6)
  • MACHINE LEARNING AND PREDICTIONS (6)
  • BIG DATA AND ITS ANALYSIS (5)
  • DATA ANALYTICS AND DATA-DRIVEN DECISION-MAKING (5)
  • DATA CONVERSION INTO A STRUCTURED FORM (5)
  • DESIGN PARAMETERIZATION AND USE OF LLM FOR CAD OPERATION (5)
  • GEOMETRY IN CONSTRUCTION: FROM LINES TO CUBIC METERS (5)
  • LLM AND THEIR ROLE IN DATA PROCESSING AND BUSINESS PROCESSES (5)
  • ORCHESTRATION OF ETL AND WORKFLOWS: PRACTICAL SOLUTIONS (5)
  • SURVIVAL STRATEGIES: BUILDING COMPETITIVE ADVANTAGE (5)
  • 4D-6D and Calculation of Carbon Dioxide Emissions (4)
  • CONSTRUCTION ERP AND PMIS SYSTEMS (4)
  • COST AND SCHEDULE FORECASTING USING MACHINE LEARNING (4)
  • DATA WAREHOUSE MANAGEMENT AND CHAOS PREVENTION (4)
  • EVOLUTION OF DATA USE IN THE CONSTRUCTION INDUSTRY (4)
  • IDE WITH LLM SUPPORT AND FUTURE PROGRAMMING CHANGES (4)
  • QUANTITY TAKE-OFF AND AUTOMATIC CREATION OF ESTIMATES AND SCHEDULES (4)
  • THE DIGITAL REVOLUTION AND THE EXPLOSION OF DATA (4)
  • Uncategorized (4)
  • CLOSED PROJECT FORMATS AND INTEROPERABILITY ISSUES (3)
  • MANAGEMENT SYSTEMS IN CONSTRUCTION (3)
  • AUTOMATIC ETL CONVEYOR (PIPELINE) (2)

Search

Search

057 Speed of decision making depends on data quality

Today’s design data architecture is undergoing fundamental changes. The industry is moving away from bulky, isolated models and closed formats towards more flexible, machine-readable structures focused on analytics, integration and process automation. However, the transition...

060 A common language of construction the role of classifiers in digital transformation

In the context of digitalization and automation of inspection and processing processes, a special role is played by classification systems elements – a kind of “digital dictionaries” that ensure uniformity in the description and parameterization...

061 Masterformat, OmniClass, Uniclass and CoClass the evolution of classification systems

Historically, construction element and work classifiers have evolved in three generations, each reflecting the level of available technology and the current needs of the industry in a particular time period (Fig. 4.2-8): First generation (early...

Don't miss the new solutions


Linux

macOS

Looking for the Linux or MAC version? Send us a quick message using the button below, and we’ll guide you through the process!


📥 Download OnePager

Welcome to DataDrivenConstruction—where data meets innovation in the construction industry. Our One-Pager offers a concise overview of how our data-driven solutions can transform your projects, enhance efficiency, and drive sustainable growth. 

🚀 Welcome to the future of data in construction!

You're taking your first step into the world of open data, working with normalized, structured data—the foundation of data analytics and modern automation tools.

By downloading, you agree to the DataDrivenConstruction terms of use 

Stay ahead with the latest updates on converters, tools, AI, LLM
and data analytics in construction — Subscribe now!

🚀 Welcome to the future of data in construction!

You're taking your first step into the world of open data, working with normalized, structured data—the foundation of data analytics and modern automation tools.

By downloading, you agree to the DataDrivenConstruction terms of use 

Stay ahead with the latest updates on converters, tools, AI, LLM
and data analytics in construction — Subscribe now!

🚀 Welcome to the future of data in construction!

You're taking your first step into the world of open data, working with normalized, structured data—the foundation of data analytics and modern automation tools.

By downloading, you agree to the DDC terms of use 

🚀 Welcome to the future of data in construction!

You're taking your first step into the world of open data, working with normalized, structured data—the foundation of data analytics and modern automation tools.

By downloading, you agree to the DataDrivenConstruction terms of use 

Stay ahead with the latest updates on converters, tools, AI, LLM
and data analytics in construction — Subscribe now!

DataDrivenConstruction offers workshops tested and practiced on global leaders in the construction industry to help your team navigate and leverage the power of data and artificial intelligence in your company's decision making.

Reserve your spot now to rethink your
approach to decision making!

Please enable JavaScript in your browser to complete this form.


🚀 Welcome to the future of data in construction!

By downloading, you agree to the DataDrivenConstruction terms of use 

Stay ahead with the latest updates on converters, tools, AI, LLM
and data analytics in construction — Subscribe now!

Have a question or need more information? Reach out to us directly!
Schedule a time to discuss your needs with our team.
Tailored sessions to help your team grow — let's plan together!
Have you attended one of our workshops, read our book, or used our solutions? Share your thoughts with us!
Please enable JavaScript in your browser to complete this form.
Name
Data Maturity Diagnostics

🧰 Data-Driven Readiness Check

This short assessment will help you identify your company's data management pain points and offer solutions to improve project efficiency. It takes only 1–2 minutes to complete and you will receive personalized recommendations tailored to your needs.

🚀 Goals and Pain Points

What are your biggest obstacles today — and your goals for the next 6 months? We’ll use your answers to build a personalized roadmap.

Build your automation pipeline

 Understand and organize your data

Automate your key process

Define a digital strategy

Move from CAD (BIM) to databases and analytics

Combine BIM, ERP and Excel

Convince leadership to invest in data

📘  What to Read in Data-Driven Construction Guidebook

Chapters 1.2, 4.1–4.3 – Technologies, Data Conversion, Structuring, Modeling:

  • Centralized vs fragmented data

  • Principles of data structure

  • Roles of Excel, DWH, and databases

Chapters 5.2, 7.2 – QTO Automation, ETL with Python:

  • Data filtering and grouping

  • Automating QTO and quantity takeoff

  • Python scripts and ETL logic

Chapter 10.2 – Roadmap for Digital Transformation:

  • Strategic stages of digital change

  • Organizational setup

  • Prioritization and execution paths

Chapters 4.1, 8.1–8.2 – From CAD (BIM) to Storage & Analytics:

  • Translating Revit/IFC to structured tables

  • BIM as a database

  • Building analytical backends

Chapters 7.3, 10.2 – Building ETL Pipelines + Strategic Integration:

  • Combining Excel, BIM, ERP

  • Automating flows between tools

  • Connecting scattered data sources

Chapters 7.3, 7.4 – ETL Pipelines and Orchestration (Airflow, n8n):

  • Building pipelines

  • Scheduling jobs

  • Using tools like Airflow or n8n to control the flow 

Chapters 2.1, 10.1 – Fragmentation, ROI, Survival Strategy:

  • Hidden costs of bad data

  • Risk of inaction

  • ROI of data initiatives

  • Convincing stakeholders

Download the DDC Guidebook for Free


🎯 DDC Workshop That Solves Your Puzzle

Module 1 – Data Automation and Workflows in Construction:
  • Overview of data sources
  • Excel vs systems
  • Typical data flows in construction
  • Foundational data logic

Module 3 – Automated Data Processing Workflow:
  • Setting up ETL workflows
  • CAD/BIM extraction
  • Automation in Excel/PDF reporting

Module 8 – Converting Unstructured CAD into Structured Formats 
  • From IFC/Revit to tables
  • Geometric vs semantic data
  • Tools for parsing and transforming CAD models

Module 13 – Key Stages of Transformation 
  • Transformation roadmap
  • Change management
  • Roles and responsibilities
  • KPIs and success metrics

Module 8 – Integrating Diverse Data Systems and Formats
  • Excel, ERP, BIM integration
  • Data connection and file exchange
  • Structuring hybrid pipelines

Module 7 – Automating Data Quality Assurance Processes 
  • Rules and checks
  • Dashboards
  • Report validation
  • Automated exception handling

Module 10 – Challenges of Digitalization in the Industry 
  • How to justify investment in data
  • Stakeholder concerns
  • ROI examples
  • Failure risks

💬 Individual Consultation – What We'll Discuss

Audit of your data landscape 

We'll review how data is stored and shared in your company and identify key improvement areas.

Select a process for automation 

We'll pick one process in your company that can be automated and outline a step-by-step plan.

Strategic roadmap planning 

Together we’ll map your digital transformation priorities and build a realistic roadmap.

CAD (BIM) - IFC/Revit model review 

We'll review your Revit/IFC/DWG data and show how to convert it into clean, structured datasets.

Mapping integrations across tools 

We’ll identify your main data sources and define how they could be connected into one workflow.

Plan a pilot pipeline (PoC) 

We'll plan a pilot pipeline: where to start, what tools to use, and what benefits to expect.

ROI and stakeholder alignment 

📬 Get Your Personalized Report and Next Steps

You’ve just taken the first step toward clarity. But here’s the uncomfortable truth: 🚨 Most companies lose time and money every week because they don't know what their data is hiding. Missed deadlines, incorrect reports, disconnected teams — all symptoms of a silent data chaos that gets worse the longer it's ignored.

Please enter your contact details so we can send you your customized recommendations and next-step options tailored to your goals.

💡 What you’ll get next:

  • A tailored action plan based on your answers

  • A list of tools and strategies to fix what’s slowing you down

  • An invite to a free 1:1 session to discuss your case

  • And if you choose: a prototype (PoC) to show how your process could be automated — fast.

157 An example of using machine learning to find project cost and schedule
This website uses cookies to improve your experience. By using this website you agree to our Data Protection Policy.
Read more
×