
We use the k-Nearest Neighbors (k-NN) algorithm as an additional predictor to estimate the cost and duration of a new project. The K-Nearest Neighbors (k-NN) algorithm is a supervised machine learning (supervised machine learning) method for both classification and regression. We have also previously discussed the k-NN algorithm in the context of vector database search (Fig. 8.2-2), where it is used to find the closest vectors (e.g., texts, images, or technical descriptions). In this approach, each project is represented as a point in a multidimensional space, where each dimension corresponds to a specific attribute of the project.
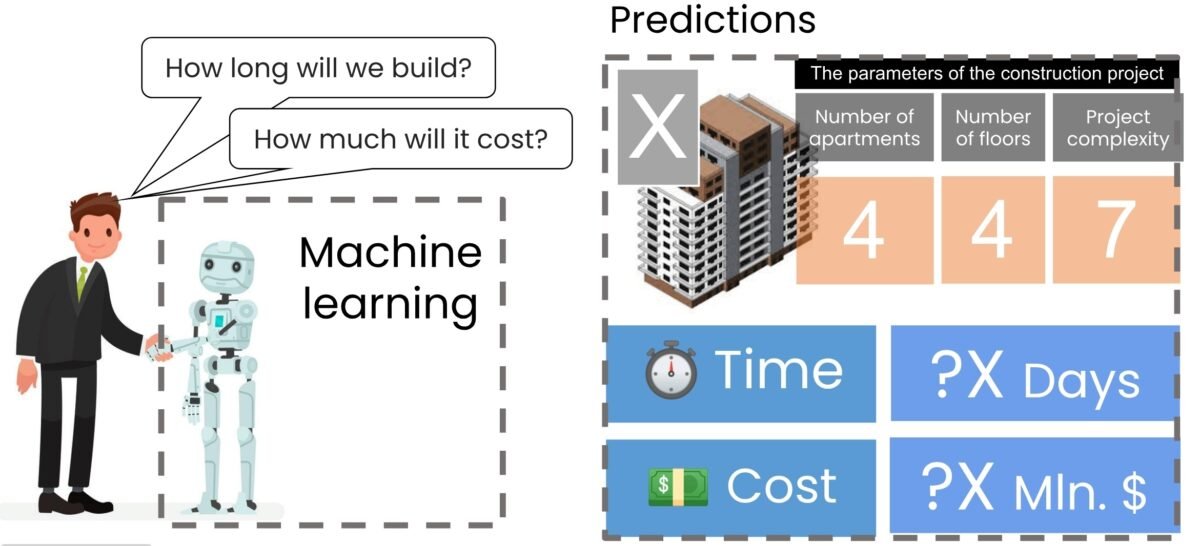
In our case, given the three attributes of each project, we will represent them as points in a three-dimensional space (Fig. 9.3-5). Thus, our upcoming project X will be localized in this space with coordinates (x=4, y=4, z=7). It should be noted that in real conditions, the number of points and the dimensionality of the space may be orders of magnitude larger.
The K-NN (k-nearest neighbors) algorithm works by measuring the distance between the desired project X and the projects in the training database. By comparing these distances, the algorithm determines the projects that are closest to the point of the new project X.
For example, if the second project (x=8, y=9, z=6) from our original dataset is much farther away from X (Fig. 9.3-5) than the other projects, it can be excluded from further analysis. As a result, only the two (k=2) nearest projects can be used for calculations, based on which the average value will be determined.
Such a method, through a neighborhood search, allows us to assess the similarities between projects, which in turn helps us to draw conclusions about the possible cost and timing of a new project based on similar projects that have been implemented previously.
")
The work of k-NN involves several key steps:
- Data preparation: training and test data sets are loaded first. Training data is used to “train” the algorithm, and test data is used to check its efficiency.
- Selecting the parameter K: a number K is selected, which indicates how many nearest neighbors (data points) should be considered in the algorithm. The value of “K” is very important because it affects the result.
- Classification process and regression for test data:
- Calculating distances: for each element from the test data, the distance to each element from the training data is calculated (Fig. 9.3-5). Different distance measurement methods can be used for this, such as Euclidean distance (the most common method), Manhattan distance or Hamming distance.
- Sorting and selecting K nearest neighbors: after calculating the distances, they are sorted and K nearest points to the test point are selected.
- Determining the class or value of a test point: if it is a classification task, the class of the test point is determined based on the most frequent class among K selected neighbors. If it is a regression task, the mean (or other measure of central tendency) of the K neighbors’ values is calculated.
- Completion of the process: once all test data has been classified or predictions have been made for it, the process is complete.
The algorithm k-nearest neighbors (k-NN) is effective in many practical applications and is one of the main tools in the arsenal of machine learning specialists. This algorithm is popular due to its simplicity and efficiency, especially in tasks where relationships between data are easy to interpret.
In our example, after applying the K-nearest neighbor algorithm, the two projects (from our small sample) with the shortest distance to project X were identified (Fig. 9.3-5). Based on these projects, the algorithm determines the average of their price and construction duration. After analysis (Fig. 9.3-6), the algorithm, by averaging the nearest neighbors, concludes that project X will cost approximately$ $3,800,000 and take about 250 days to complete.
")
The k-Nearest Neighbors (k-NN) algorithm is particularly popular in classification and regression tasks, such as recommendation systems, where it is used to suggest products or content based on preferences similar to the interests of a particular user. In addition, k-NN is widely used in medical diagnostics to classify types of diseases based on patient symptoms, in pattern recognition, and in the financial sector to assess the creditworthiness of customers.
Even with limited data, machine learning models can provide useful predictions and significantly enhance the analytical component of construction project management. As historical data is expanded and cleaned up, it is possible to move to more complex models – for example, taking into account the type of construction, location, season of construction start and other factors.
Our simplified problem used three attributes for visualization in three-dimensional space, but real projects, on average, include hundreds or thousands of attributes (see the dataset from the chapter “Example of CAD (BIM) based big data”), which greatly increases the dimensionality of the space and the complexity of representing projects as vectors (Fig. 9.3-7).
")
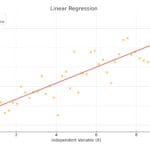
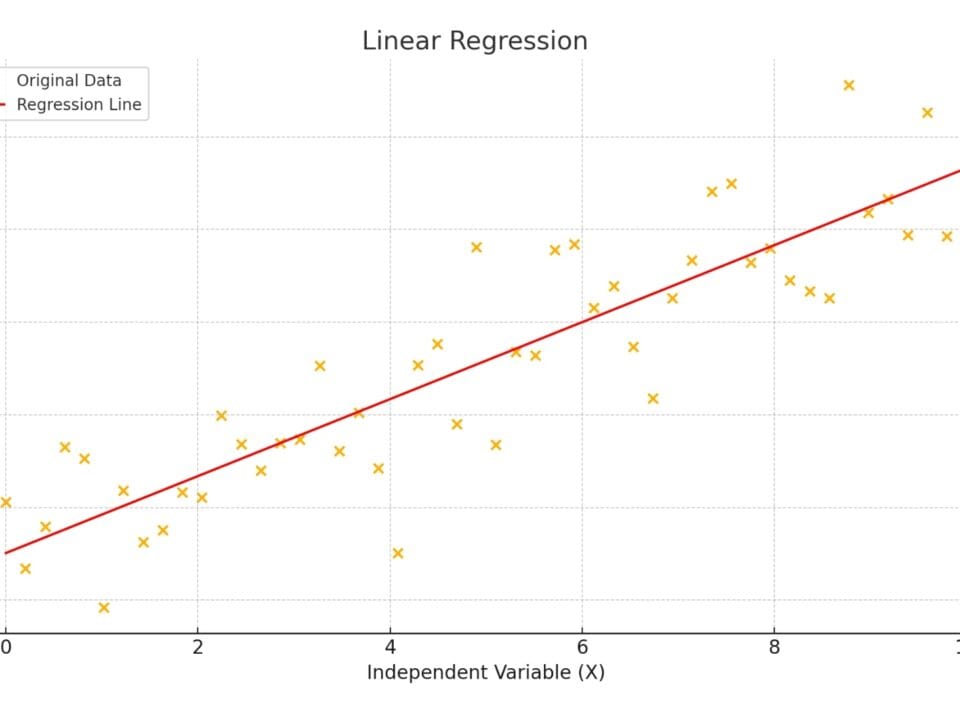
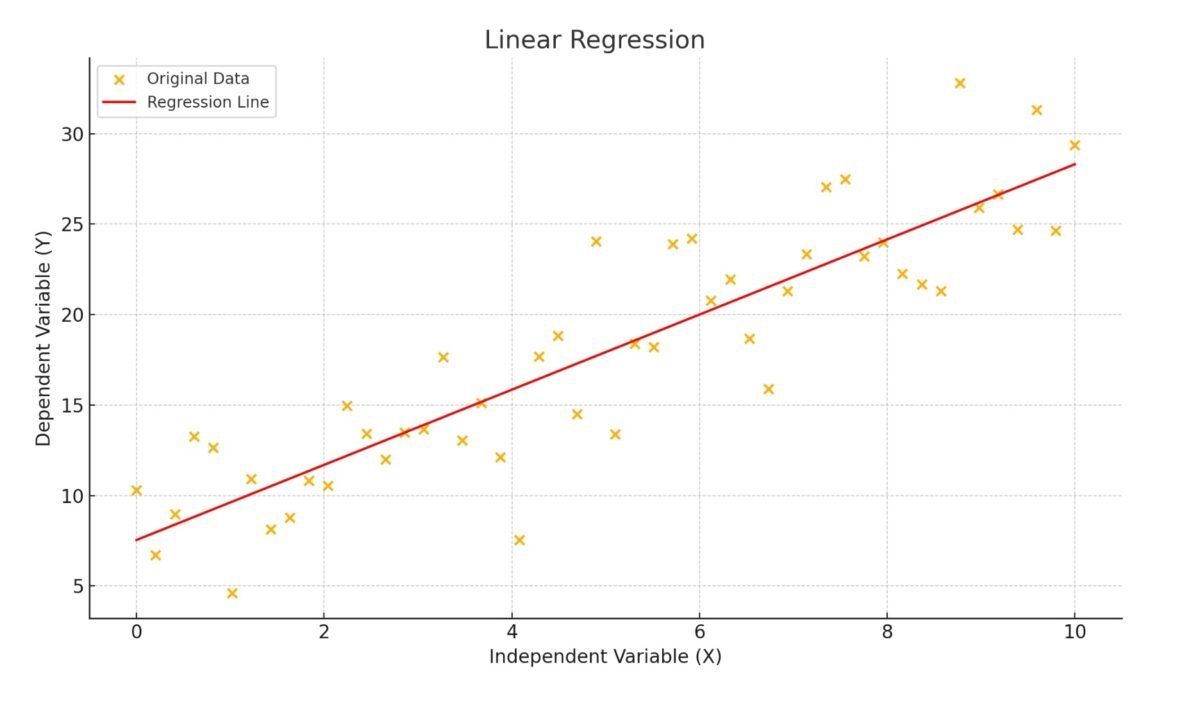
Applying different algorithms to the same data set for project X, which has 40 apartments, 4 floors, and a complexity level of 7, yielded different predicted values. The linear regression algorithm predicted a completion time of 238 days and a cost of$ 3,042,338 (Fig. 9.3-4), while the k-NN algorithm predicted 250 days and$ 3,882,000 (Fig. 9.3-6).
The accuracy of predictions obtained using machine learning models, directly depends on the volume and quality of the input data. The more projects are involved in training, and the more completely and accurately their characteristics (attributes) and results (labels) are represented, the higher the probability of obtaining reliable predictions with minimal error values.
Data preprocessing techniques play an important role in this process, including:
Normalization to bring features to a common scale;
Outlier detection and elimination that eliminates model distortion;
Coding of categorical attributes to allow manipulation of textual data;
Filling in missing values, increasing the stability of the model.
In addition, cross-validation methods are used to assess the generalizability of the model and its robustness to new datasets to detect overfitting and improve the reliability of the prediction.
Chaos is an order to be deciphered(J. Saramago, “Quotable Quote,”).
– José Saramago, “The Double”
Even if it seems to you that the chaos of your tasks cannot be described formally, know that any event in the world and especially construction processes are subject to mathematical laws, which may need support for calculating values not through strict formulas but with the help of statistics and historical data.
Both traditional estimates performed by estimating departments and machine learning models inevitably face uncertainty and potential sources of error. However, when sufficient quality data is available, machine learning models can demonstrate comparable and sometimes even higher prediction accuracy than expert estimates.
Machine learning is likely to become a reliable complementary tool for analysis, allowing to: refine calculations, propose alternative scenarios and identify hidden dependencies between project parameters. Such models will not claim to be universal, but they will soon occupy an important place in calculations and project decision-making processes. Machine learning technologies will not exclude the participation of engineers, estimators and analysts, but, on the contrary, will expand their capabilities by offering an additional point of view based on historical data.
If properly integrated into the business processes of construction companies, machine learning has the potential to become an important element in the management decision support system – not as a replacement for humans, but as an extension of their professional intuition and engineering logic.


