Due to the ever-increasing number of systems in companies, managers responsible for various systems are moving around the departments, who, unable to keep up with the growing amount of information, ask specialists to create data in such a way that this data can be used in other systems and applications.
Engineers and specialists who create data often do not know and do not understand where the data they create will be used later.
Therefore, the main problem of the managing managers of companies working in the construction industry is to make the process transparent and understandable for all participants.

Business is based on the interaction of different roles in the construction industry, each requiring certain attributes critical to their fulfillment
To develop precise data requirements for a construction project, it's essential to start by comprehensively understanding the processes and applications involved. Construction projects vary greatly in complexity, often encompassing dozens to thousands of applications and systems, each requiring accurate up-to-date information and continuous monitoring.
To effectively write data requirements in existing tables and databases, one must first understand the specifics of the processes and applications for which the data is being collected.
To begin validating the data, it is necessary to define the data use scenarios data usage scenarios and develop requirements for them
In the following example, we will look at a scenario in which technicians maintaining various systems, tables, and databases in a company are populating a project with data to fulfil a client's request to add a new window to the current project.
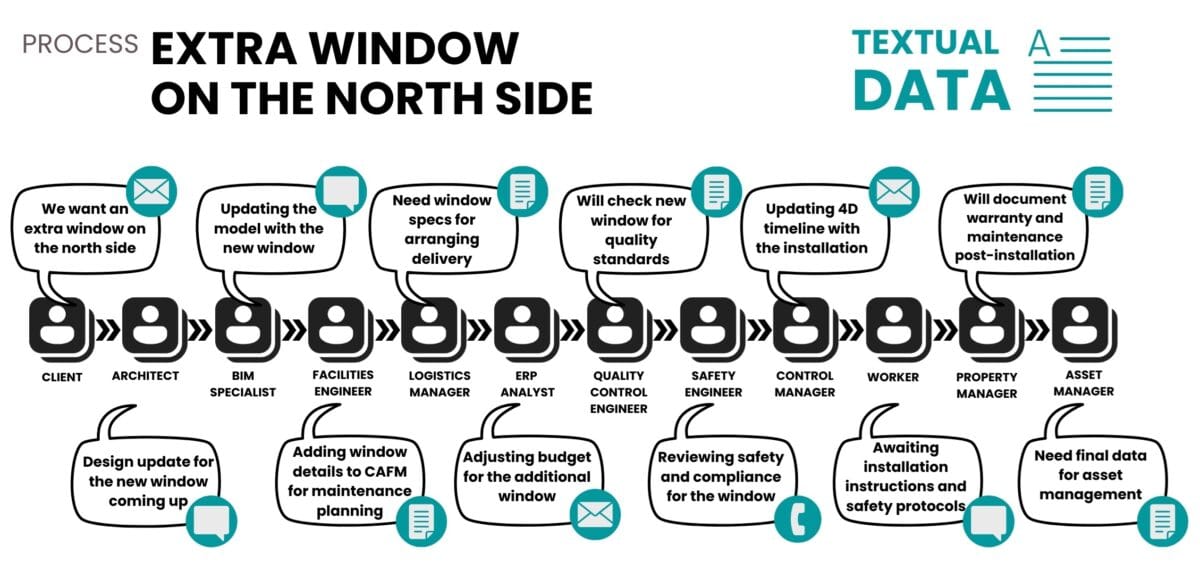
Analyzing and gathering process requirements starts with finding all stakeholders. Let's imagine a company has a project where the client makes a new request - "add an additional window on the north side of the building".
The small process of "client request to add a new window to the current project" involves the architect, client, CAD (BIM) specialist, construction manager, logistics manager, ERP analyst, quality control engineer, safety engineer, control manager and real estate manager.
Even a small process can involve dozens to hundreds of different specialists. Each process participant needs to understand the requirements of the specialists to whom they are linked at the data level.
At the textual level, the communication between the client and the specialists is as follows:
➤ Customer: "We have decided to add an additional window on the north side for better lighting. Can this be realized?"
➤ Architect: "Of course, I will revise the design to include the new window and send updated CAD (BIM) plans."
➤ CAD (BIM) specialist: "Got a new project. I update CAD (BIM) model with additional window and after coordination with statistician I provide exact location and dimensions of new window.
➤ Construction Manager: "New design received. We adjust the timing of 4D installation and inform all relevant organisations".
➤ Facilities Engineer (CAFM): "I will enter 6D data on the new window into the CAFM system for future facility management and maintenance planning."
➤ Logistics Manager: "I need the dimensions and weight of the new window to organize the delivery of the window to the site."
➤ ERP Analyst: "Updating the 5D budget in our ERP system to reflect the cost of the new window in the overall project estimate."
➤ Quality Control Engineer: "Once the window specifications are ready, I will make sure they meet our quality and material standards."
➤ Safety Engineer: 'I will assess the safety aspects of the new window, focusing on compliance and 8D evacuation.
➤ Controls Manager: "Let's update our 4D timeline to reflect the new window installation and save the new data into the project's content management system."
➤ Worker (installer): "Need instructions on installation, assembly, and lead times. Also, any special safety protocols I need to follow?
➤ Property Manager: "Once installed, I will document warranty and maintenance information for long-term management."
➤ Asset Manager: 'Equipment Engineer, please send final data for asset tracking and lifecycle management'.
➤ Client: "Wait, maybe I'm in a hurry and the window won't be needed. It might be worth making a balcony.".
In this scenario, communication between different professionals, including the client and the architect, occurs predominantly through textual data such as emails, dialogs, calls and meetings.
The textual layer of client-performer communication contains multiformat textual data
In such a text-based communication system for a construction project, a system of legal confirmation and recording of all data exchange transactions and all decisions made is essential. This is to ensure that every decision, instruction and change made is legally valid and traceable, reducing the risk of misunderstandings in the future.
The lack of legal control and confirmation of decisions in the relevant systems of a construction project can lead to serious problems for all involved. Every decision, instruction or change made without proper documentation and confirmation can lead to disputes and legal proceedings.
Lack of text transaction confirmations not only delays the project but can also lead to additional financial losses and deterioration of relationships between project participants.
Legal fixation of all decisions in text communication can be ensured only with a large number of signed documents, which will fall on the shoulders of the management, which will be obliged to record all transactions. Text-based communication require each specialist to either familiarize himself with the full correspondence or to participate in all meetings on a regular basis to understand the current status of the project.
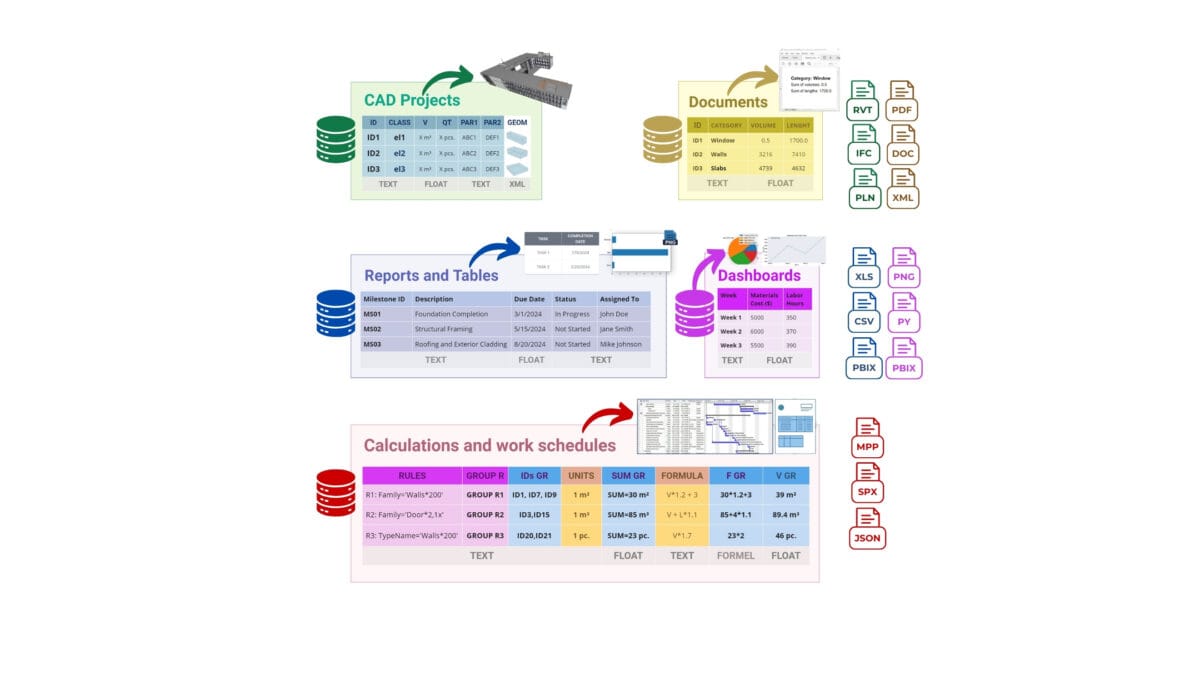
Each system in the landscape of construction companies serves as a source for legally relevant documents in different formats
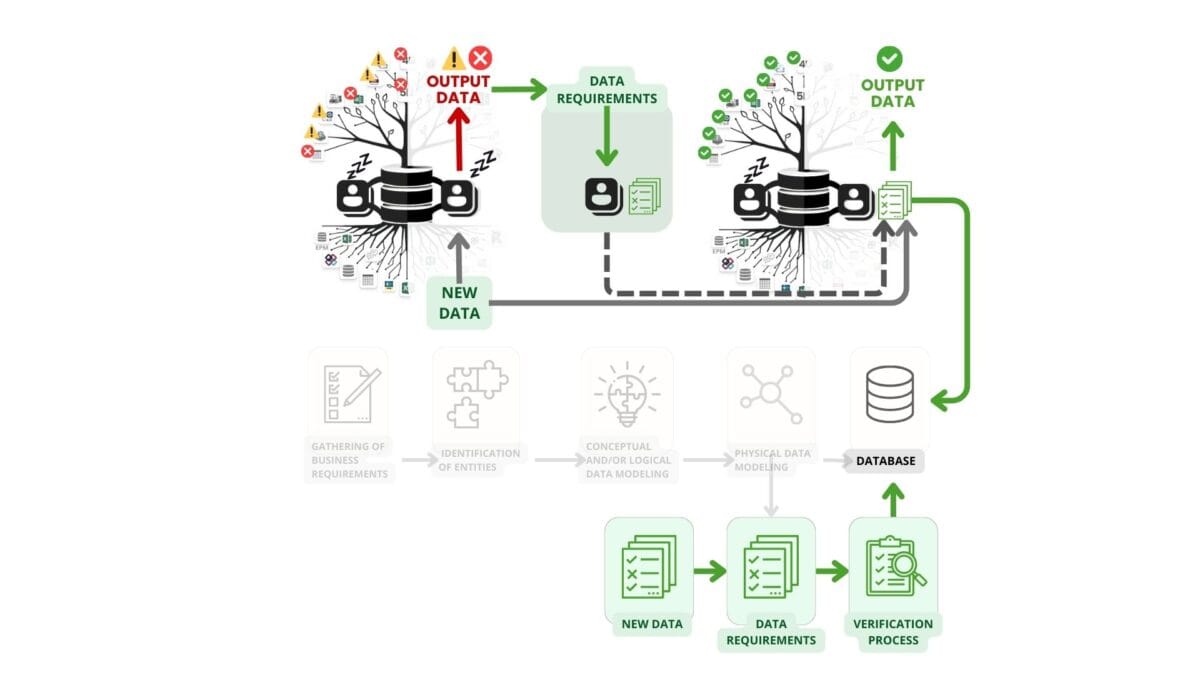
In order to move from textual communication and textual records of "decision-making operations" to the system level, methods for converting textual operations into a more structured and usable format are needed. As in data modelling (Figure 2.5-2), we moved from the contextual-idea level to the conceptual level, adding the systems and tools used by participants and the links between them.

To learn how to manage and automate the validation process it is necessary to visualize and structure the requirements
And the first step in systematising requirements and relationships is to visualise all links and relationships with the help of visual flowcharts. The conceptual level not only makes it easier for all process participants to understand the entire process chain, but also visualises why and for whom data is needed at each process step.
Block diagrams of processes and the effectiveness of conceptual frameworks
Due to the rapid growth of digitised documents, when specialists only captured and stored data in tables and databases, the requirements for data, collection processes and the databases or tables themselves were rarely formed.
To bridge the gap between traditional data management practices and today's digital requirements, it is necessary to recognize the evolution of data handling from simple storage to sophisticated analysis and automation.
This transformation requires a shift to a structured and conceptualized approach to data management. By focusing on creating conceptual frameworks and visual representations such as flowcharts, organisations can better understand both the features and intricacies of their own processes.
If there is a need for processes not just to store data, but to analyse or automate it, then it is necessary to start dealing with the topic of creating a conceptual-visual level of requirements.
As we move toward more complex data ecosystems, implementing conceptual and visual tools becomes critical to ensure that data processes are not only efficient, but also aligned with the organization's strategic goals. Data consistency starts with a thorough understanding of use cases, which lays the foundation for defining the minimum requirements for data collection and analysis.
Adopting minimalism in data practices naturally leads to improved data governance. With a clear framework based on minimum requirements, organisations can implement effective data governance strategies that ensure the quality, security, and compliance of data throughout lifecycle.

Starting with understanding use cases to define minimum requirements ensures data collection is purposeful and minimal
In our example, each specialist can be part of not only a small team, but also a larger department including up to a dozen experts under the control of a general manager. Each department uses a specialized application database (e.g. ERP, CAD, MEP, CDE, ECM, CPM) that is regularly updated with incoming information needed to create documents, record the legal status of decisions and manage processes.
It is similar to the work of ancient managers 4,000 years ago, when clay tablets and papyrus were used to legally confirm decisions. The difference between modern systems and their clay and paper predecessors is that modern methods additionally add the process of converting textual information into digital form for further processing in other systems and tools.
Creating a visualization of the process in the form of conceptual flowcharts will help to describe each step and the interaction between different roles, making a complex workflow clearer and simpler.
The dialog that takes place between the participants at the initial stage of setting a task from the client about installation of a new window - in the flowchart will be represented as follows: specialists will be designated as users of systems or databases, and their messages and requests will be replaced by communication lines with the direction of arrows, showing the interaction between different systems.

At the conceptual level in the block diagram, the dialog between project participants is represented in such a way that specialists act as database users, and their messages and queries form links between the systems
Process visualization ensures that the logic of the entire process is transparent and accessible to all team members.
Unfortunately, often when presenting processes in the form of flowcharts with standard documents attached, specialists and managers limit themselves to the " conceptual level" of process visualisation, believing that the project participants will understand their functions thanks to the flowchart and cope with requirements and data quality checks on their own.
At a conceptual level, it is difficult for specialists to understand the requirements of other systems and applications in the company used in different departments. This difficulty arises because process participants often do not understand what their own data requirements are and cannot determine from conceptual flowcharts what data requirements are needed by their colleagues with whom they interact in the overall process.
As a result, even if a process is already described in detail at a conceptual level using flowcharts, this does not necessarily make it more efficient. Visualization often simply makes the work of managers easier, who, having applied a step-by-step reporting system, can now more conveniently request information from colleagues and track the process manually using flowcharts.
To fully translate this process to the data level, we need to go a level deeper and translate the conceptual visualisation of the process to the logical and physical level of data, required attributes and their boundary values.
Structured requirements and RegEx regular expressions
The majority of data (80%) in companies is created in unstructured formats, which slows down or makes it often impossible to flow smoothly, so we convert textual, unstructured and semi-structured data into structured form to improve the efficiency of data processing.
In the same way that specialists often do not know how to translate multi-format data into structured formats, specialists also do not know how to structure their requirements and wishes, leaving them in text format throughout the process.
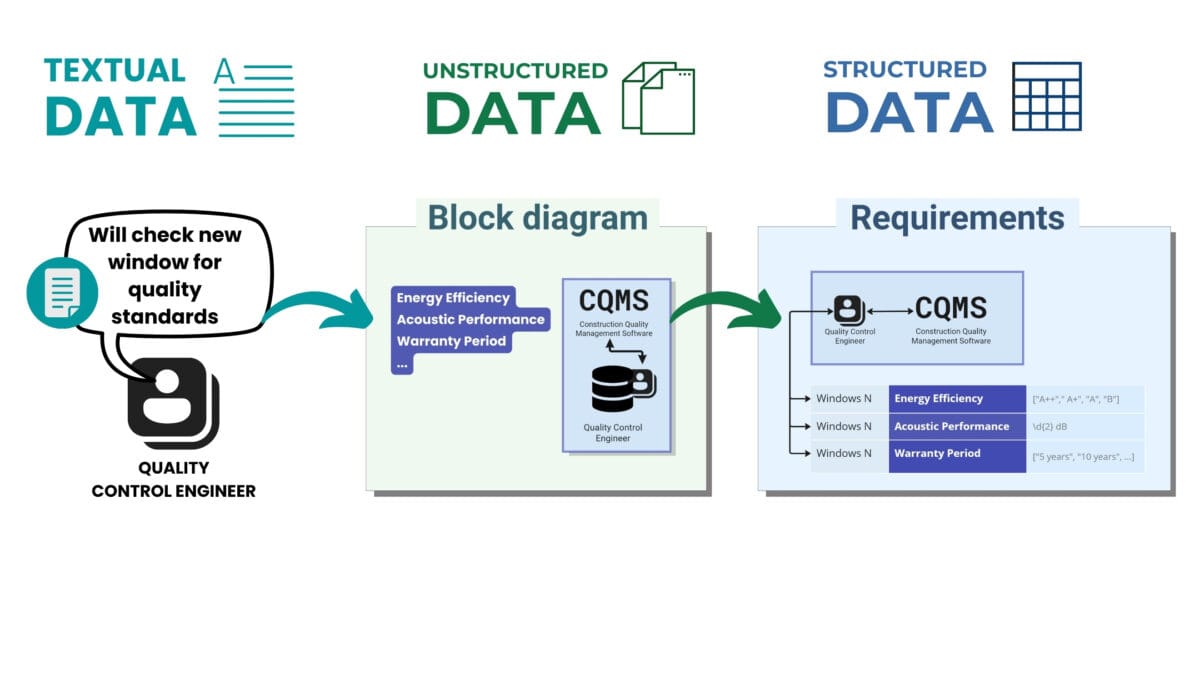
Just as we have already converted data from unstructured text form to structured form, in our requirements process we will convert textual requirements into "logical and physical level" structured format.
In tabular form, we will describe the requirements for each system in the form of attributes and their boundary values.
. Translating requirements from a text format to a structured table description of entity attributes makes it easier for other specialists to understand the required information
In our example, let's take a closer look at the needs of a quality control engineer who uses a construction quality management system (CQMS) to ensure that the standards and requirements of a building product, in this case window systems, are met.
As an example, consider some important requirements for attributes of window system type entities in CQMS: energy efficiency, acoustic performance and warranty period. Each category includes certain standards and specifications that must be considered when designing and installing window systems.
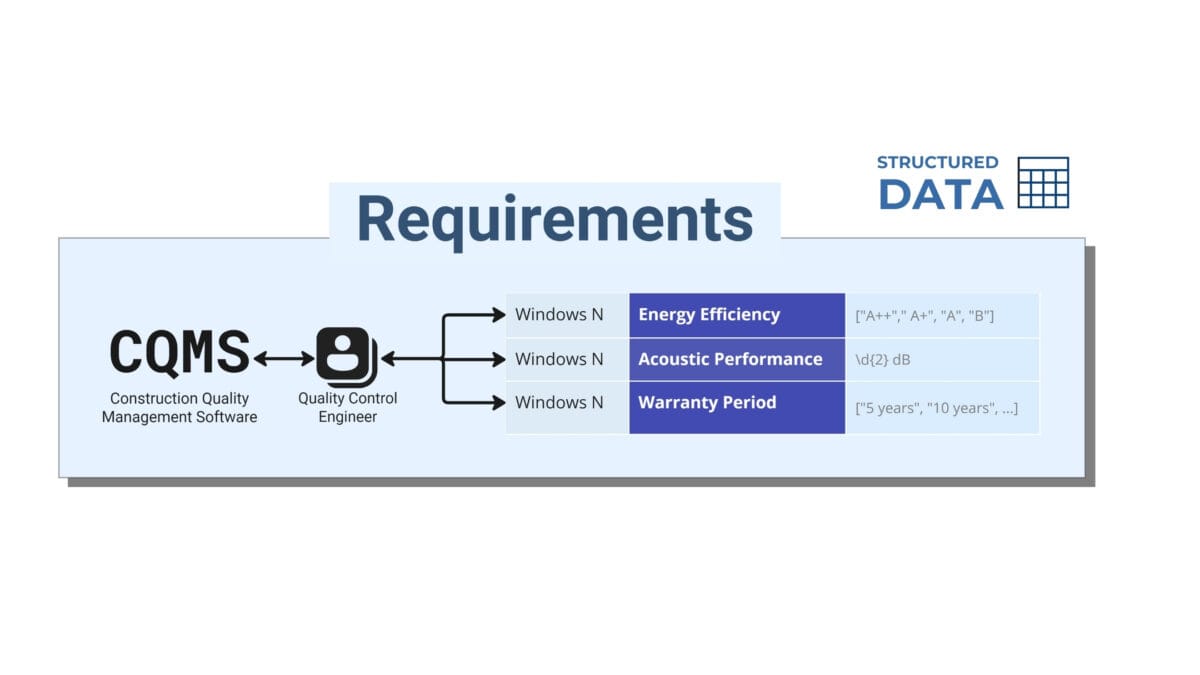
A quality control engineer uses CQMS to ensure that new entity type elements of window systems meet attribute standards for energy efficiency, acoustical performance, and warranty period
The data requirements that the QA engineer sets up in the form of a table have the following boundary values:
- Window energy efficiency class attributes range from "A++", denoting the highest efficiency, to "B", considered the minimum acceptable level, and these classes are represented by the list ["A++", "A+", "A", "A", "B"].
- The attribute acoustic insulation of windows, measured in decibels and showing their ability to reduce street noise, is defined by the regular expression d{2}dB.
- The attribute warranty period for window type entity starts at five years, setting this period as the minimum allowed when selecting a product; warranty period values are also specified, e.g. ["5 years", "10 years", etc.].
Within the established attributes, classes below "B" such as "C" or "D" will not pass inspection for window energy efficiency when new data becomes available. Acoustic insulation of windows, in data or documents that come to the Quality Control Engineer must be labeled with a two-digit number followed by the postfix "dB", such as "35dB" or "40dB", and values outside of this format, such as "9dB" or "100dB", will not be acceptable. The warranty period must begin with a minimum of "5 years" and shorter periods such as "3 years" or "4 years" will not meet the requirements that the quality engineer has described in the table format.
In order to check values against boundary values from requirements during the validation process we use regular expressions (acoustic insulation of windows) to check data consistency and integrity based on predefined rules.
Regular expressions (RegEx, are used in programming languages, including Python (Re), to find and manipulate strings. Regex is like a detective in the world of strings, able to identify text patterns in text with precision.
In regular expressions, letters are described directly using the corresponding characters of the alphabet, while numbers can be represented using the special character d, which corresponds to any digit from 0 to 9. Square brackets are used to indicate a range of letters or digits, e.g., [a-z] for any lowercase letter of the Latin alphabet or [0-9], which is equivalent to d. For non-numeric characters and non-letter characters, D and W are used respectively.
Popular RegEx use cases:
- Checking an email address: To check if the string is a valid email address, the template ^[a-zA-Z0-9._%+-]+@[a-zA-Z0-9.-]+.[a-zA-Z]{2,}$ can be used.
- Date Extraction: bd{2}d{2}d{2}d{2}d{2}.d{2}.d{4}b template can be used to extract the date from the text in DD.MM.YYYYY format.
- Phone Number Verification: To verify phone numbers in the format +49(000)000-0000, the pattern will look like +d{2}(d{3})d{3}-d{4}.
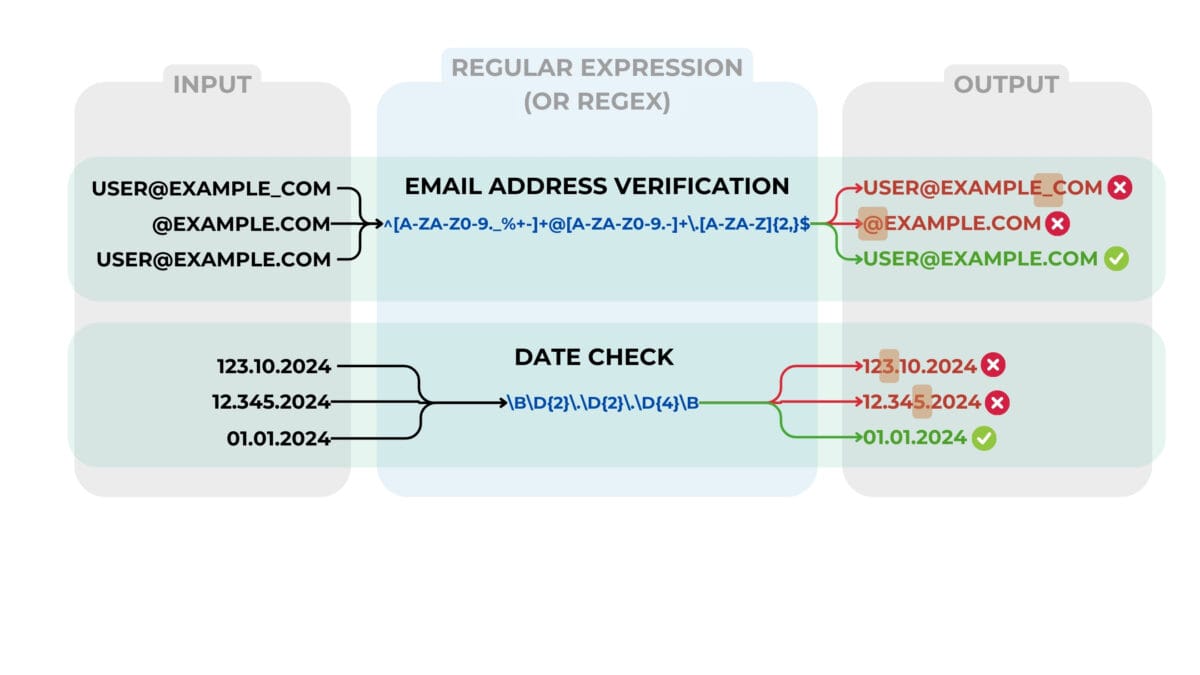
Apply regular expressions in validation to ensure that data meets requirements by performing tasks such as validating email addresses or dates using predefined templates
By translating the QA engineer's requirements into the format of attributes and their boundary values, we have transformed them from their original text format into an organised and structured table, thus facilitating future validation and analysis of incoming data. By having requirements, we do not need data that has not been validated, while validated data can be automatically transferred to systems for further processing.
Now we will convert all the requirements of all the specialists from our new window installation process into an organised list in attribute format and add these lists from the required attributes to our flowchart for each specialist..
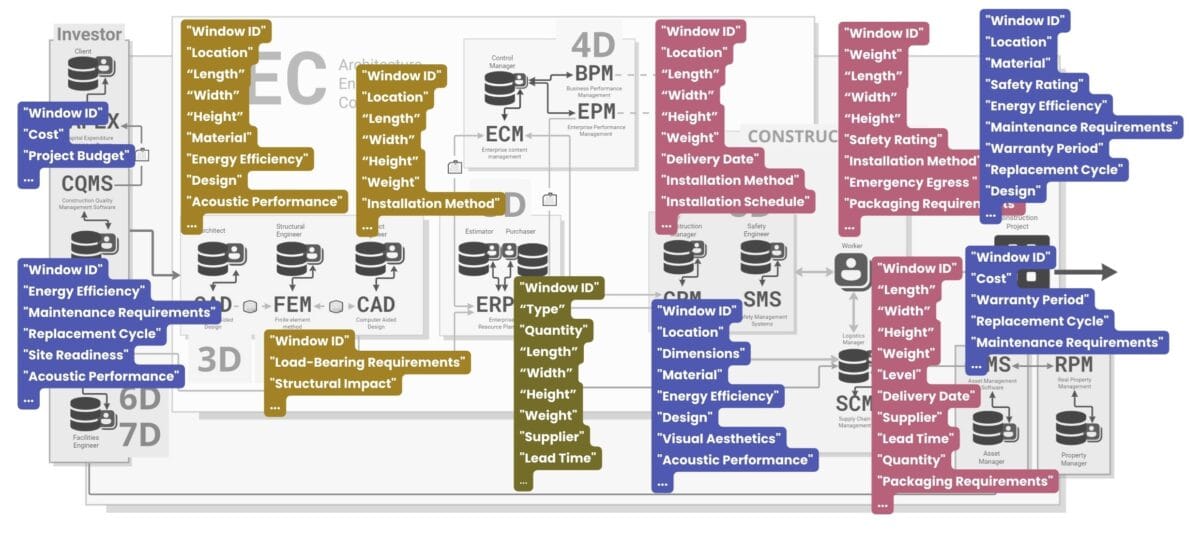
At the logical level of the process to each specialist on the block diagram are added the attributes with which the specialist works in the corresponding systems
By adding all attributes to one common process table, we transform the information previously presented in the form of text and dialogue into a structured and systematized form of tables linked by means of a block diagram.

Conversion of unstructured text into structured tables for the convenience of specialists, in understanding the requirements for each other at a logical level
The data requirements are now clearly structured and the next step is to collect the data and prepare it for the validation process. The requirements for each system should be communicated to the specialists who create the data for those specific systems. Only when the requirements are in hand can the data creation phase begin.
Checking the presence of attributes and their values in the created data will allow us to ensure that the information provided has reached the required level of quality and is ready to be used in the appropriate use cases important to the professionals at a particular stage of the process of adding a new window entity to the project. If the data meets the requirements like a green light, we can automatically route it to the right people and systems for which the data was intended.