
In later parts of the book, we will look in detail at how specialists interact with each other and how data becomes the basis for decision making, automation, and operational efficiency. Fig. 2.2-5 provides an example diagram showing the sequence of data processing steps in a data-centric approach. This diagram illustrates the Continuous Improvement Pipeline), parts of which will be discussed in detail later in the book.

The system describing the business processes of a medium-sized company is built on a multi-level principle. It includes: data collection, cleaning, aggregation, analytical processing, and decision-making based on the results. We will study all these stages later in the book – both in a theoretical context and through practical examples:
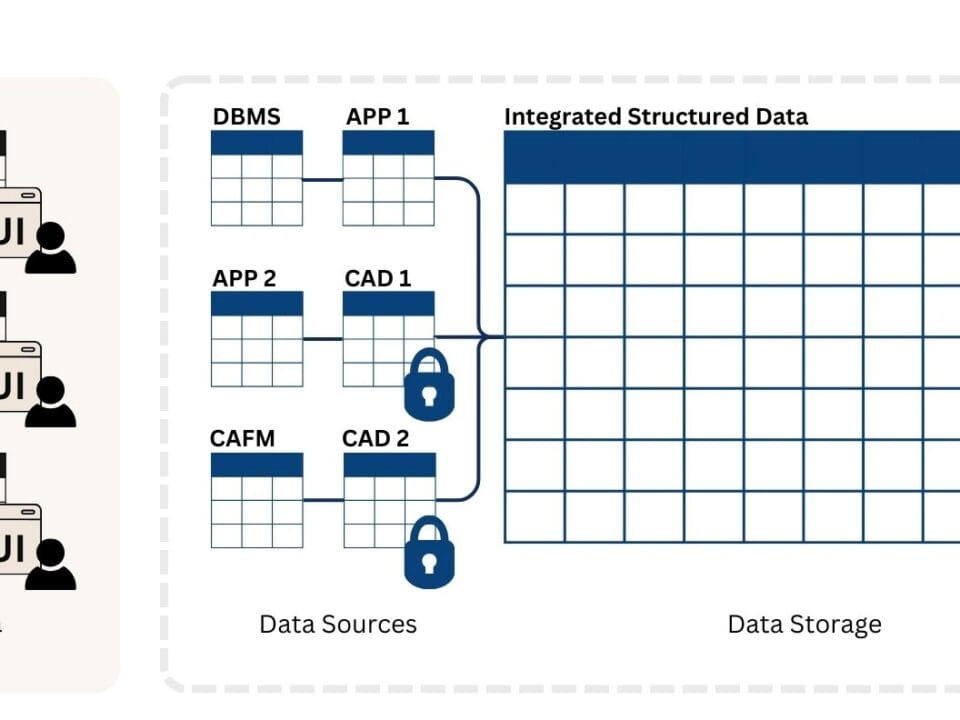
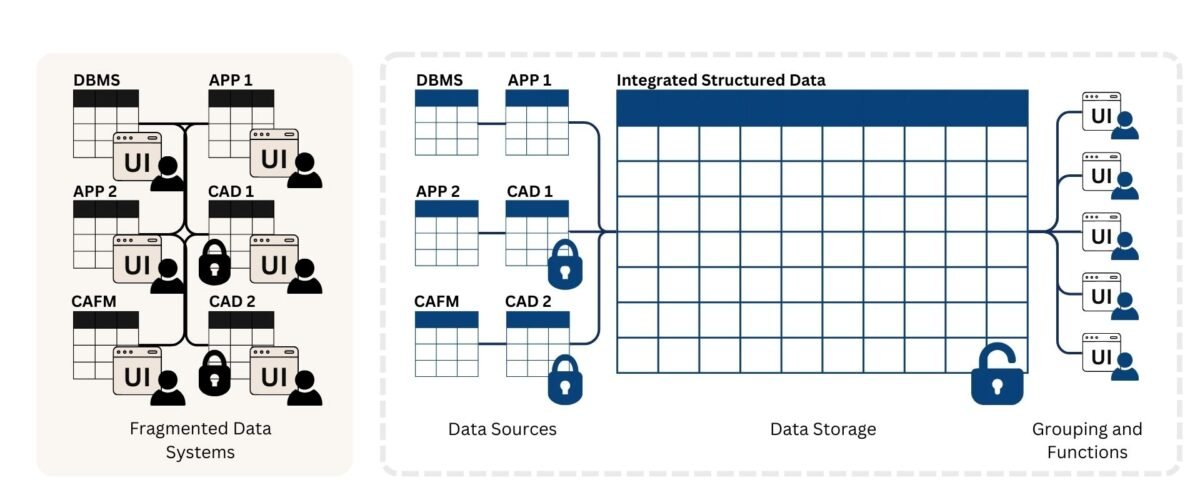
At the first level, data entry takes place (Fig. 3.1-1). Information is received both manually (through reports, forms, logs) and in an automated form (from API, sensors, software systems). Data can be of different structure: geometric, text, unstructured. At this stage there is a need for standardization, structuring and unification of information flows.
The next level is data processing and transformation. It includes the processes of cleaning, removing duplicates, correcting errors, and preparing information for further analysis (Fig. 4.2-5). This stage is critical because the quality of analytics directly depends on the cleanliness and accuracy of the data.
The data is then entered into specialized tables, dataframes or databases divided by functional areas: budgeting and accounting, models and drawings, logistics, security and infrastructure. This division allows for easy access and cross-analysis of information.
The data is then aggregated and displayed in an analytics dashboard (showcase). Here, the methods of descriptive, diagnostic, predictive and prescriptive analytics are applied. This helps answer key questions (Fig. 1.1-4): what happened, why it happened, what will happen in the future, and what actions need to be taken. For example, the system can identify delays, predict project completion, or optimize resources.
Finally, the last level generates analytical conclusions and key indicators that help to monitor contract fulfillment, manage investments and improve business processes (Fig. 7.4-2). This information becomes the basis for decision-making and the company’s development strategy.
Similarly, data goes from being collected to being used in strategic management. In the following parts of the book, we will look at each stage in detail, focusing on data types, data processing techniques, analytics tools and real-life cases of how these approaches are used in the construction industry.


