image141
078 Calculation of calculations and costing of works on the basis of resource base
10 June 2025
080 Moving from 3D to 4D and 5D using volumetric and quantitative parameters
10 June 2025

079 Final project costing from estimates to budget

State and industry-specific estimating standards play different roles in construction practice in different countries. While some countries require strict adherence to a single standard, most developed economies adopt a more flexible approach. In market economies, government construction standards usually serve only as a baseline. Construction companies adapt these standards to their operating models or completely revise them, supplementing them with their own customized factors. These adjustments reflect corporate experience, resource management efficiency and often factors in which, for example, a company’s speculative profits may be factored in.

As a result, the level of competition, market demand, target margins and even relationships with specific customers can lead to significant deviations from standard norms. This practice provides market flexibility, but at the same time makes it difficult to transparently compare bids from different contractors, introducing an element of speculative pricing into the construction industry at this stage of the calculation process.

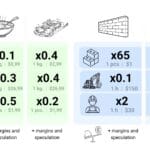
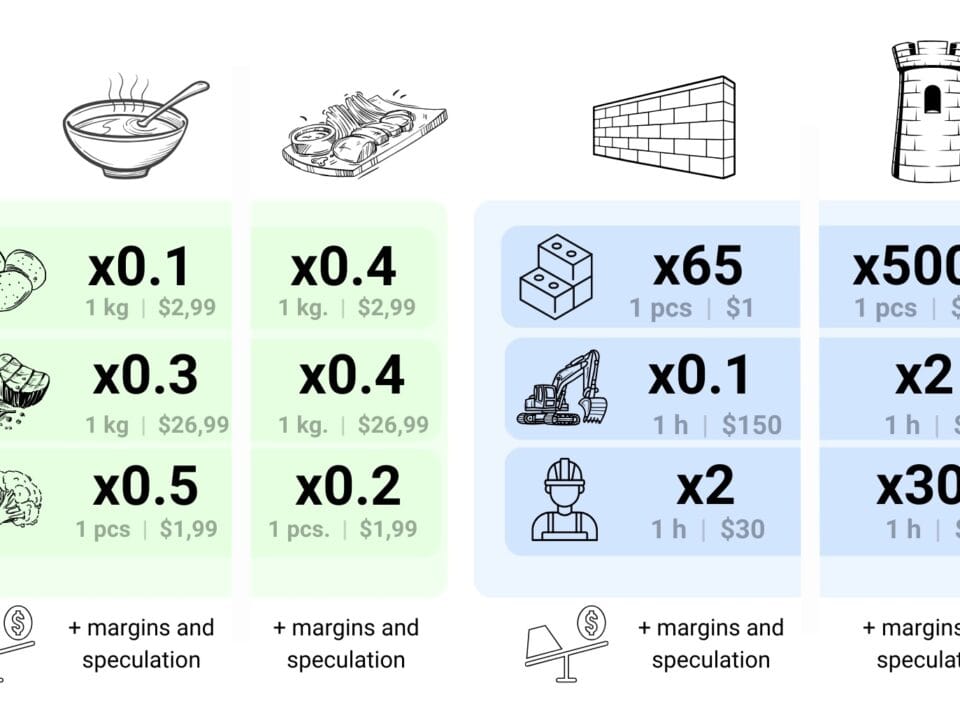
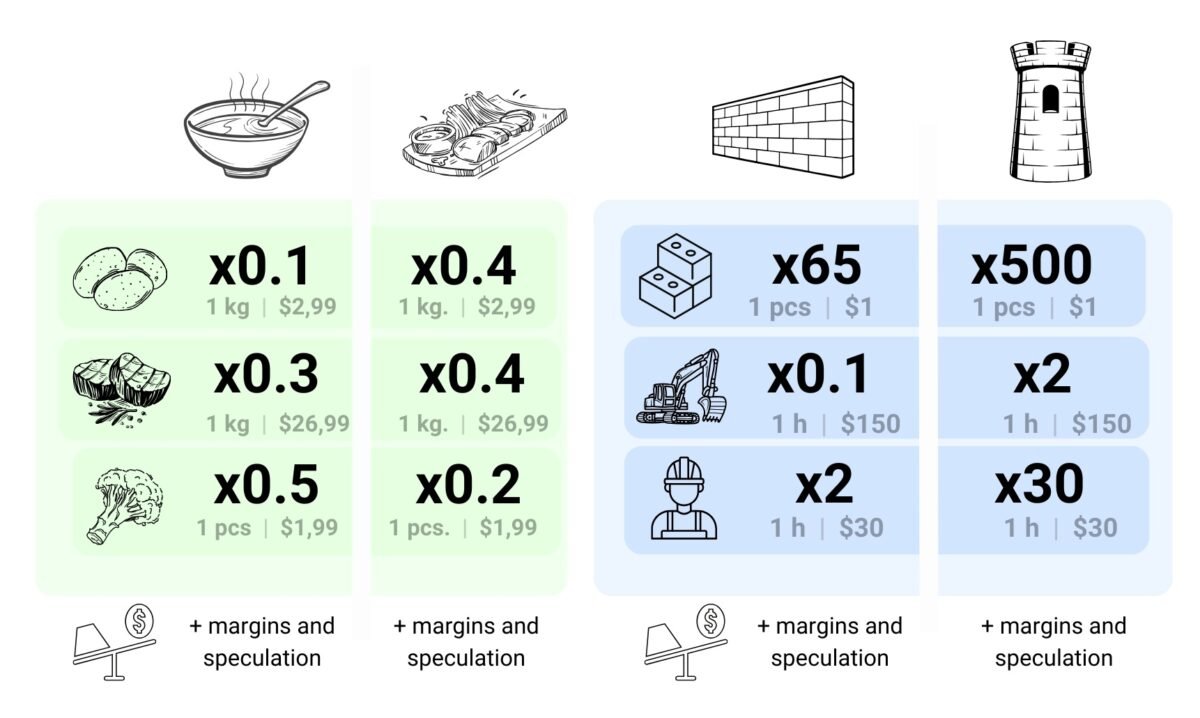
Once the calculation templates for individual types of work and processes have been prepared – or, more often, simply copied from standard government estimates (Fig. 5.1-7), with coefficients added to reflect the “peculiarities” of a particular company – the final step is to multiply the cost of each item by the corresponding attribute of the scope of work or processes in the new project.

When calculating the total cost of a new construction project, the key step is to summarize the costs of all costing items, multiplied by the volume of these items-work in the project.

To create the total cost of the project, in our simplified example, we start by calculating the cost of building one square meter of wall and multiply the cost of its calculation (e.g. the work “1m² standard installation of wall elements”) by the total number of square meters of walls in the project (e.g. the “Area” or “Quantity” attribute (Fig. 5.1-8) of an entity of type “Wall elements” from CAD of the project or the foreman’s calculations).

Similarly, we calculate the cost for all elements of the project (Fig. 5.1-8): we take the cost of a unit of work and multiply it by the volume of a particular element or its group in a given project. The estimator only has to enter the number of these elements, activities or processes in the project in in the form of volume or quantity. This allows to automatically generate a complete construction estimate.

image117
Fig. 5.1-8 At the estimate creation stage, we only enter the scope of work.

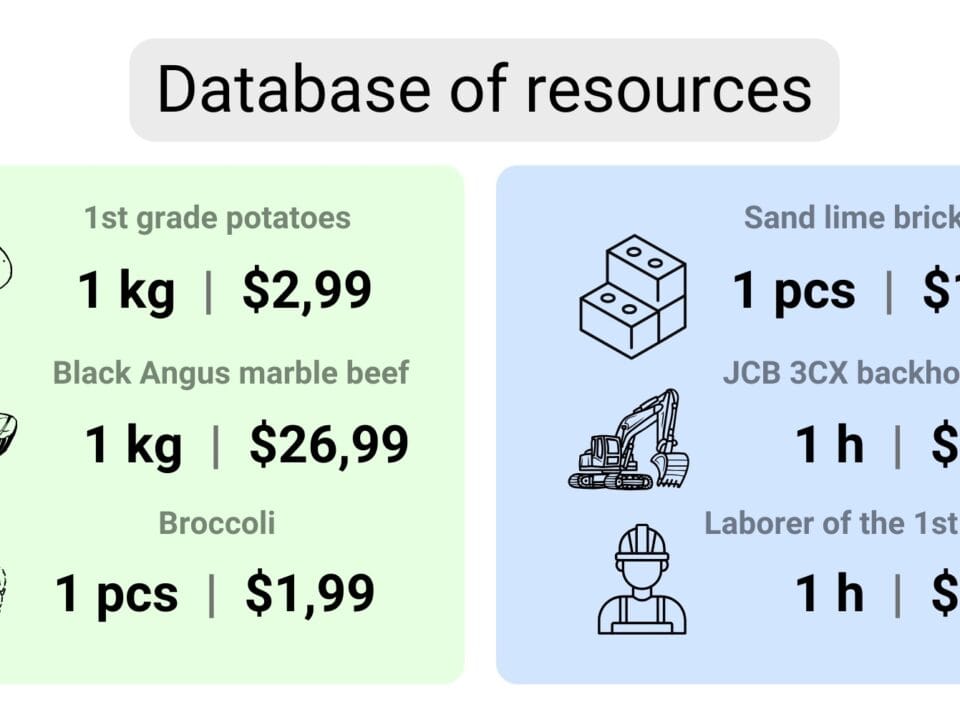
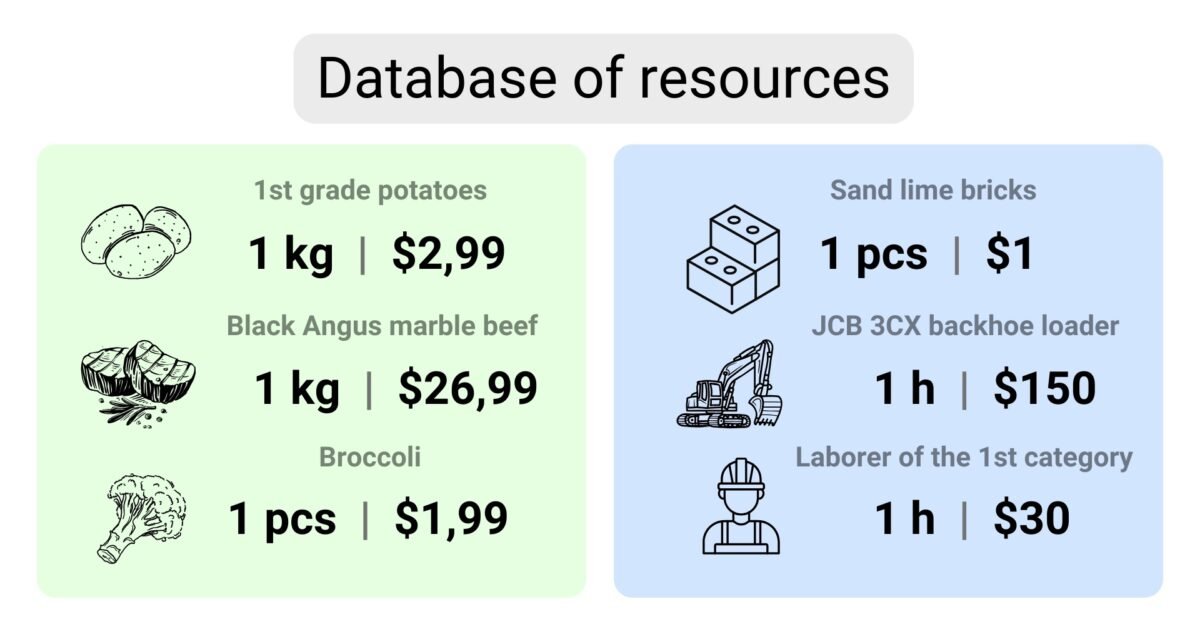
As in the case of calculations, at this level we load automatically ready calculated items (from the template of calculations or new ones copied from the template and edited), which automatically bring with them the current cost per unit of work (which is updated automatically from the resource database (Fig. 5.1-8 bottom table)). Accordingly, in case of any change of data in the resource database or costing tables – the data in the estimate will be automatically updated for the current day, without the need to change the costing or the estimate itself.

In the restaurant context, the final cost of an event is calculated in a similar manner and equals the final cost of the entire dinner, where the cost of each dish multiplied by the number of guests adds up to the total cost of the check (Fig. 5.1-9). And just as in construction, recipes for cooking in a restaurant may not change for decades. Unlike prices, where the cost of ingredients can change every hour.

Just as a restaurant owner multiplies the cost of each meal by the number of servings and people to determine the total cost of the event, the cost estimating manager adds up the cost of all project components to arrive at a complete construction estimate.

Thus, for each work in the project, its final cost is determined (Fig. 5.1-9), which, multiplied by the attribute volume of the entity corresponding to this work – gives the cost of groups of works, from which the final cost of the entire project is obtained.

image93
Fig. 5.1-9 The final estimate is calculated by summing each element’s work cost attribute by its scope attribute.

The Total Project Cost (Fig. 5.1-8) presents a financial picture of the project, allowing customers, investors, or financial institutions to understand the total budget and financial resources required for the project on any given day, taking into account current prices.

And if the processes of compiling resource bases, calculations and estimates (process recipes) have already been worked out, semi-automated and honed by tens of thousands of years and recorded at the state level, then the automatic obtaining of quality information about the volume and quantity of elements for the last stage of the final estimate – today remains a bottleneck in the processes of all calculations of cost and time attributes of the project, and in general the overall budget of the project.

For millennia, the traditional method of calculating volumes has been manual methods of measuring volume and quantity using flat drawings. With the advent of the digital age, companies have discovered that volume and quantity information can now be automatically extracted from the geometric data contained in CAD models, revolutionizing the millennia-old ways of obtaining quantitative data.

Modern approaches to process estimating and estimating involve automatically extracting volumetric and quantitative attributes from CAD databases, which can be uploaded and connected to the costing process to get up-to-date project group volumes at any stage of design through to operation.

.

.

.

Change language

Post's Highlights

Stay updated: news and insights


We’re Here to Help

Fresh solutions are released through our social channels

Leave a Reply

Your email address will not be published. Required fields are marked *

Focus Areas

navigate
  • ALL THE CHAPTERS IN THIS PART
  • A PRACTICAL GUIDE TO IMPLEMENTING A DATA-DRIVEN APPROACH (8)
  • CLASSIFICATION AND INTEGRATION: A COMMON LANGUAGE FOR CONSTRUCTION DATA (8)
  • DATA FLOW WITHOUT MANUAL EFFORT: WHY ETL (8)
  • DATA INFRASTRUCTURE: FROM STORAGE FORMATS TO DIGITAL REPOSITORIES (8)
  • DATA UNIFICATION AND STRUCTURING (7)
  • SYSTEMATIZATION OF REQUIREMENTS AND VALIDATION OF INFORMATION (7)
  • COST CALCULATIONS AND ESTIMATES FOR CONSTRUCTION PROJECTS (6)
  • EMERGENCE OF BIM-CONCEPTS IN THE CONSTRUCTION INDUSTRY (6)
  • MACHINE LEARNING AND PREDICTIONS (6)
  • BIG DATA AND ITS ANALYSIS (5)
  • DATA ANALYTICS AND DATA-DRIVEN DECISION-MAKING (5)
  • DATA CONVERSION INTO A STRUCTURED FORM (5)
  • DESIGN PARAMETERIZATION AND USE OF LLM FOR CAD OPERATION (5)
  • GEOMETRY IN CONSTRUCTION: FROM LINES TO CUBIC METERS (5)
  • LLM AND THEIR ROLE IN DATA PROCESSING AND BUSINESS PROCESSES (5)
  • ORCHESTRATION OF ETL AND WORKFLOWS: PRACTICAL SOLUTIONS (5)
  • SURVIVAL STRATEGIES: BUILDING COMPETITIVE ADVANTAGE (5)
  • 4D-6D and Calculation of Carbon Dioxide Emissions (4)
  • CONSTRUCTION ERP AND PMIS SYSTEMS (4)
  • COST AND SCHEDULE FORECASTING USING MACHINE LEARNING (4)
  • DATA WAREHOUSE MANAGEMENT AND CHAOS PREVENTION (4)
  • EVOLUTION OF DATA USE IN THE CONSTRUCTION INDUSTRY (4)
  • IDE WITH LLM SUPPORT AND FUTURE PROGRAMMING CHANGES (4)
  • QUANTITY TAKE-OFF AND AUTOMATIC CREATION OF ESTIMATES AND SCHEDULES (4)
  • THE DIGITAL REVOLUTION AND THE EXPLOSION OF DATA (4)
  • Uncategorized (4)
  • CLOSED PROJECT FORMATS AND INTEROPERABILITY ISSUES (3)
  • MANAGEMENT SYSTEMS IN CONSTRUCTION (3)
  • AUTOMATIC ETL CONVEYOR (PIPELINE) (2)

Search

Search

057 Speed of decision making depends on data quality

Today’s design data architecture is undergoing fundamental changes. The industry is moving away from bulky, isolated models and closed formats towards more flexible, machine-readable structures focused on analytics, integration and process automation. However, the transition...

060 A common language of construction the role of classifiers in digital transformation

In the context of digitalization and automation of inspection and processing processes, a special role is played by classification systems elements – a kind of “digital dictionaries” that ensure uniformity in the description and parameterization...

061 Masterformat, OmniClass, Uniclass and CoClass the evolution of classification systems

Historically, construction element and work classifiers have evolved in three generations, each reflecting the level of available technology and the current needs of the industry in a particular time period (Fig. 4.2-8): First generation (early...

Don't miss the new solutions


Linux

macOS

Looking for the Linux or MAC version? Send us a quick message using the button below, and we’ll guide you through the process!


📥 Download OnePager

Welcome to DataDrivenConstruction—where data meets innovation in the construction industry. Our One-Pager offers a concise overview of how our data-driven solutions can transform your projects, enhance efficiency, and drive sustainable growth. 

🚀 Welcome to the future of data in construction!

You're taking your first step into the world of open data, working with normalized, structured data—the foundation of data analytics and modern automation tools.

By downloading, you agree to the DataDrivenConstruction terms of use 

Stay ahead with the latest updates on converters, tools, AI, LLM
and data analytics in construction — Subscribe now!

🚀 Welcome to the future of data in construction!

You're taking your first step into the world of open data, working with normalized, structured data—the foundation of data analytics and modern automation tools.

By downloading, you agree to the DataDrivenConstruction terms of use 

Stay ahead with the latest updates on converters, tools, AI, LLM
and data analytics in construction — Subscribe now!

🚀 Welcome to the future of data in construction!

You're taking your first step into the world of open data, working with normalized, structured data—the foundation of data analytics and modern automation tools.

By downloading, you agree to the DDC terms of use 

🚀 Welcome to the future of data in construction!

You're taking your first step into the world of open data, working with normalized, structured data—the foundation of data analytics and modern automation tools.

By downloading, you agree to the DataDrivenConstruction terms of use 

Stay ahead with the latest updates on converters, tools, AI, LLM
and data analytics in construction — Subscribe now!

DataDrivenConstruction offers workshops tested and practiced on global leaders in the construction industry to help your team navigate and leverage the power of data and artificial intelligence in your company's decision making.

Reserve your spot now to rethink your
approach to decision making!

Please enable JavaScript in your browser to complete this form.


🚀 Welcome to the future of data in construction!

By downloading, you agree to the DataDrivenConstruction terms of use 

Stay ahead with the latest updates on converters, tools, AI, LLM
and data analytics in construction — Subscribe now!

Have a question or need more information? Reach out to us directly!
Schedule a time to discuss your needs with our team.
Tailored sessions to help your team grow — let's plan together!
Have you attended one of our workshops, read our book, or used our solutions? Share your thoughts with us!
Please enable JavaScript in your browser to complete this form.
Name
Data Maturity Diagnostics

🧰 Data-Driven Readiness Check

This short assessment will help you identify your company's data management pain points and offer solutions to improve project efficiency. It takes only 1–2 minutes to complete and you will receive personalized recommendations tailored to your needs.

🚀 Goals and Pain Points

What are your biggest obstacles today — and your goals for the next 6 months? We’ll use your answers to build a personalized roadmap.

Build your automation pipeline

 Understand and organize your data

Automate your key process

Define a digital strategy

Move from CAD (BIM) to databases and analytics

Combine BIM, ERP and Excel

Convince leadership to invest in data

📘  What to Read in Data-Driven Construction Guidebook

Chapters 1.2, 4.1–4.3 – Technologies, Data Conversion, Structuring, Modeling:

  • Centralized vs fragmented data

  • Principles of data structure

  • Roles of Excel, DWH, and databases

Chapters 5.2, 7.2 – QTO Automation, ETL with Python:

  • Data filtering and grouping

  • Automating QTO and quantity takeoff

  • Python scripts and ETL logic

Chapter 10.2 – Roadmap for Digital Transformation:

  • Strategic stages of digital change

  • Organizational setup

  • Prioritization and execution paths

Chapters 4.1, 8.1–8.2 – From CAD (BIM) to Storage & Analytics:

  • Translating Revit/IFC to structured tables

  • BIM as a database

  • Building analytical backends

Chapters 7.3, 10.2 – Building ETL Pipelines + Strategic Integration:

  • Combining Excel, BIM, ERP

  • Automating flows between tools

  • Connecting scattered data sources

Chapters 7.3, 7.4 – ETL Pipelines and Orchestration (Airflow, n8n):

  • Building pipelines

  • Scheduling jobs

  • Using tools like Airflow or n8n to control the flow 

Chapters 2.1, 10.1 – Fragmentation, ROI, Survival Strategy:

  • Hidden costs of bad data

  • Risk of inaction

  • ROI of data initiatives

  • Convincing stakeholders

Download the DDC Guidebook for Free


🎯 DDC Workshop That Solves Your Puzzle

Module 1 – Data Automation and Workflows in Construction:
  • Overview of data sources
  • Excel vs systems
  • Typical data flows in construction
  • Foundational data logic

Module 3 – Automated Data Processing Workflow:
  • Setting up ETL workflows
  • CAD/BIM extraction
  • Automation in Excel/PDF reporting

Module 8 – Converting Unstructured CAD into Structured Formats 
  • From IFC/Revit to tables
  • Geometric vs semantic data
  • Tools for parsing and transforming CAD models

Module 13 – Key Stages of Transformation 
  • Transformation roadmap
  • Change management
  • Roles and responsibilities
  • KPIs and success metrics

Module 8 – Integrating Diverse Data Systems and Formats
  • Excel, ERP, BIM integration
  • Data connection and file exchange
  • Structuring hybrid pipelines

Module 7 – Automating Data Quality Assurance Processes 
  • Rules and checks
  • Dashboards
  • Report validation
  • Automated exception handling

Module 10 – Challenges of Digitalization in the Industry 
  • How to justify investment in data
  • Stakeholder concerns
  • ROI examples
  • Failure risks

💬 Individual Consultation – What We'll Discuss

Audit of your data landscape 

We'll review how data is stored and shared in your company and identify key improvement areas.

Select a process for automation 

We'll pick one process in your company that can be automated and outline a step-by-step plan.

Strategic roadmap planning 

Together we’ll map your digital transformation priorities and build a realistic roadmap.

CAD (BIM) - IFC/Revit model review 

We'll review your Revit/IFC/DWG data and show how to convert it into clean, structured datasets.

Mapping integrations across tools 

We’ll identify your main data sources and define how they could be connected into one workflow.

Plan a pilot pipeline (PoC) 

We'll plan a pilot pipeline: where to start, what tools to use, and what benefits to expect.

ROI and stakeholder alignment 

📬 Get Your Personalized Report and Next Steps

You’ve just taken the first step toward clarity. But here’s the uncomfortable truth: 🚨 Most companies lose time and money every week because they don't know what their data is hiding. Missed deadlines, incorrect reports, disconnected teams — all symptoms of a silent data chaos that gets worse the longer it's ignored.

Please enter your contact details so we can send you your customized recommendations and next-step options tailored to your goals.

💡 What you’ll get next:

  • A tailored action plan based on your answers

  • A list of tools and strategies to fix what’s slowing you down

  • An invite to a free 1:1 session to discuss your case

  • And if you choose: a prototype (PoC) to show how your process could be automated — fast.

079 Final project costing from estimates to budget
This website uses cookies to improve your experience. By using this website you agree to our Data Protection Policy.
Read more
×