080 Moving from 3D to 4D and 5D using volumetric and quantitative parameters
10 June 2025
image48
083 QTO automation using LLM and structured data
10 June 2025

082 QTO Quantity Take-Off grouping project data by attributes

QTO (Quantity Take-Off) in construction is the process of extracting the quantitative characteristics of the elements required to realize a project. In practice, QTO is often a semi-manual process involving data collection from various sources: PDF documents, DWG drawings and CAD models.

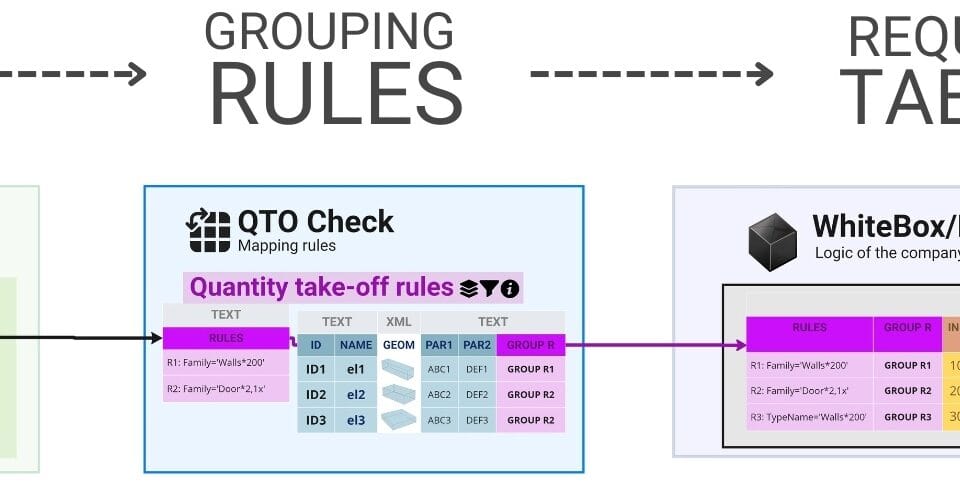
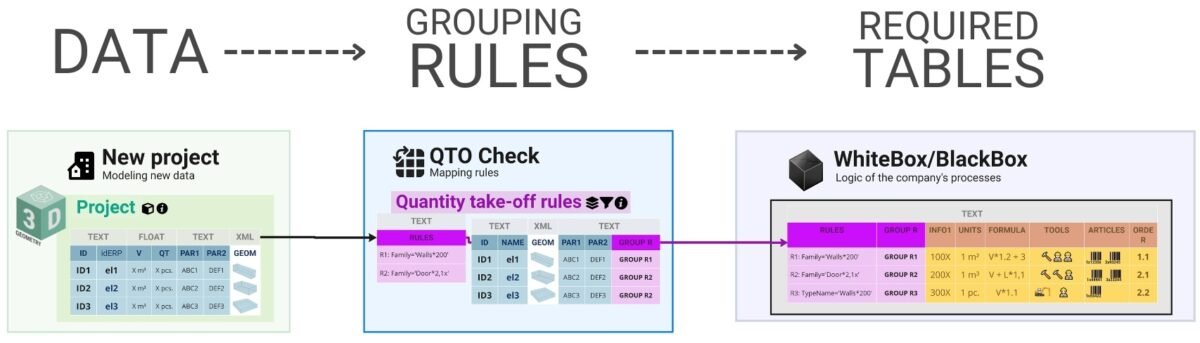
When working with data extracted from CAD databases, the QTO process is realized as a sequence of filtering, sorting, grouping and aggregation operations. Model elements are selected by class, category and type parameters, and then their quantitative attributes – such as volume, area, length or quantity – are summarized according to the calculation logic (Fig. 5.2-2).

Рисунок 4
Fig. 5.2-2 Data grouping and filtering are the most popular functions applied to databases and data warehouses.

The QTO (filtering and grouping) process allows to systematize data, form specifications and prepare source information for calculating estimates, purchases and work schedules. The basis of QTO is the classification of elements according to the type of measured attributes. For each element or group of elements the corresponding quantitative measurement parameter is selected. For example:

  • Length attribute (curbstone – in meters)
  • Area attribute (drywall work – in square meters)
  • Volume attribute (concrete works – in cubic meters)
  • Quantity attribute (windows – per piece)

In addition to the volumetric characteristics generated mathematically from the geometry, after grouping QTOs, overrun factors are often applied in calculations (Fig. 5.2-12 e.g. 1.1 to account for 10% in logistics and installation) – correction values that take into account losses, installation, storage or transportation features. This makes it possible to predict the actual consumption of materials more accurately and to avoid both shortages and overstocking on the construction site.

An automated quantity take-off process (QTO) is essential for producing accurate calculations and estimates, reducing human error in the processes of finding volume specifications and preventing over- or under-ordering of materials.

As an example of QTO process, let’s consider a common case when it is necessary to show from CAD database a table-specification of volumes by element types for a certain category, classes of elements. Let’s group all project elements by type from the CAD project wall category and summarize the volume attributes for each type to present the result as a QTO volume table (Fig. 5.2-3).

In the example of a typical CAD project (Fig. 5.2-3), all wall category elements within the CAD database are grouped by wall type, e.g. “Lamelle 11.5”, “MW 11.5” and “STB 20.0”, and have well-defined volume attributes represented in metric cubes.

The goal of the manager, who is at the interface between designers and calculation specialists, is to obtain an automated table of volumes by element type in the selected category. Not only for a specific project, but also in a universal form applicable to other projects with a similar model structure. This allows the approach to be scalable and allows data to be reused without duplication of effort.

Gone are the days when experienced designers and estimators used to arm themselves with a ruler, carefully measuring every line on paper or PDF -plans – a tradition that has not changed over the past millennia. With the development of 3D -modeling, where the geometry of each element is now directly linked to automatically calculated volumetric attributes, the process of determining volumes and QTO quantities has become automated.

image95
Fig. 5.2-3 Obtaining QTO scope and quantity attributes from a project involves grouping and filtering project elements.

In our example, the task is to “select a category of walls in a project, group all elements by type, and present the scope attribute information in a structured, tabular format” so that this table can be used by dozens of other professionals for costing calculations, logistics, schedules, and other business cases (Fig. 6.1-3).

Due to the closed nature of CAD data not every specialist today can use direct access to the CAD database (the reasons and solutions to the access problem are detailed in the sixth part of the book). Therefore, many are forced to turn to specialized BIM tools based on the concepts of open BIM and closed BIM (А. Boiko, “Lobbykriege um Daten im Bauwesen | Techno-Feudalismus und die Geschichte von BIMs,” 2024). When working with specialized BIM -tools or directly in the CAD program environment, the table with QTO (Quantity Take-Off) results can be generated in different ways – depending on whether manual interface or software automation is used.

For example, using the user interface of CAD (BIM) software, it is enough to perform about 17 actions (button clicks) to get a ready table of volumes (Fig. 5.2-4). However, the user must have a good understanding of the model structure and functions of the CAD (BIM) software.

If automation is applied through program code or through plug-ins and API tools within CAD programs, the number of manual steps to obtain the volume tables is reduced, but 40 to 150 lines of code will need to be written, depending on the library or tool used:

  • IfcOpSh (open BIM) or Dynamo IronPython (closed BIM) – allow you to get a QTO table from a CAD format or CAD program in just ~40 lines of code.
  • IFC_js (open BIM) – requires approximately 150 lines of code to extract voluminous attributes from the IFC model.
  • Interface CAD tools (BIM) – allows you to get the same result manually, in 17 mouse clicks.

.

image157
Fig. 5.2-4 CAD (BIM) designers and managers, use 40 to 150 lines of code or a dozen keystrokes to create QTO tables

The result is the same – a structured table with volume attributes for a group of elements. The only difference is the labor costs and the necessary level of technical training of the user (Fig. 5.2-4). Modern tools, in relation to manual collection of volumes, significantly speed up the QTO process and reduce the probability of errors. They allow data to be extracted directly from the project model, eliminating the need to manually recalculate volumes from drawings, as was done in the past.

Regardless of the method used – whether open BIM or closed BIM – it is possible to obtain an identical QTO – table with project element volumes (Fig. 5.2-4). However, when working with project data in CAD – (BIM-) concepts, users depend on specialized tools and APIs, provided by vendors (Fig. 3.2-13). This creates additional layers of dependency and requires learning unique data schemas while limiting direct access to the data.

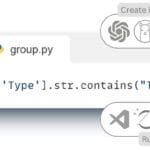
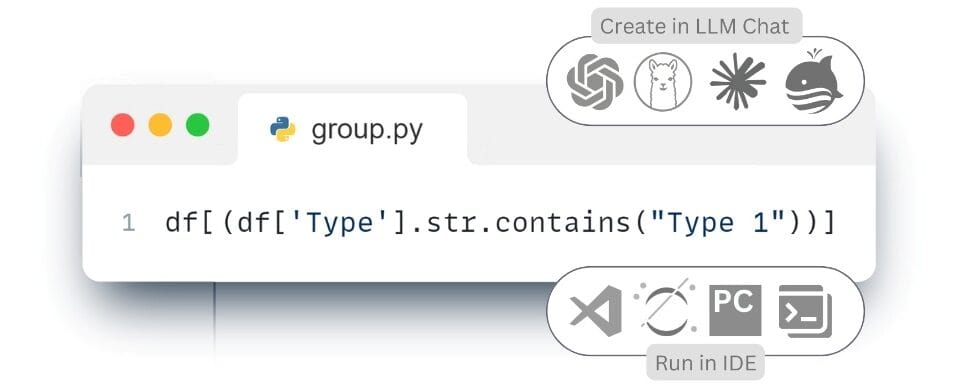
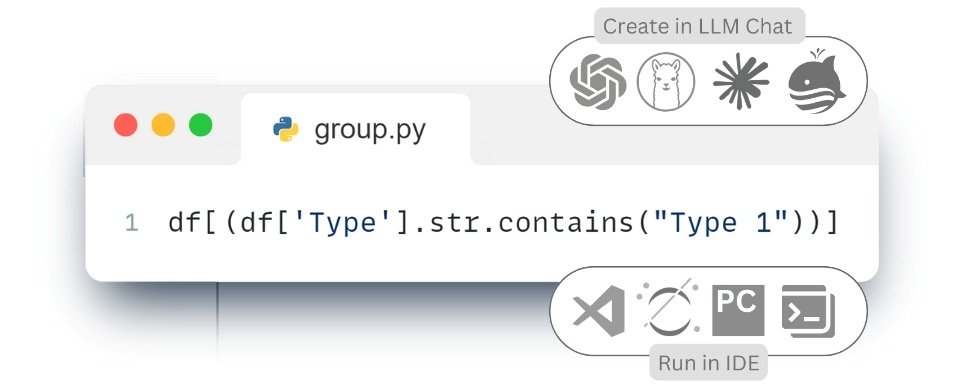
Due to the closed nature of CAD-data, obtaining QTO-tables and other parameters complicates the automation of calculations and integration with external systems. By using tools for direct access to databases and transferring CAD project data using reverse engineering tools into an open structured dataframe format (Fig. 4.1-13), an identical QTO table can be obtained with just one line of code (Fig. 5.2-5 – variant with granular data).

image64
Fig. 5.2-5 Different tools produce the same results in the form of attribute tables of project entities, but with different labor costs.

When using open structured data from CAD projects, as mentioned in the chapter “Converting CAD (BIM) data into structured form”, the grouping process, QTO, is greatly simplified.

Approaches based on the use of open structured data or direct access to CAD model databases are free from the marketing constraints associated with the acronym BIM. They rely on proven tools long used in other industries (Fig. 7.3-10 ETL process).

According to the McKinsey study “Open Data: Unleash Innovation and Productivity with Streaming Information” (McKinsey Global Institute, “Open data: Unlocking innovation and performance with liquid information,” October 2013) conducted in 2013, the use of open data can create opportunities for savings of $30 to $50 billion per year in the design, engineering, procurement, and construction of electric power facilities. This translates into a 15 percent savings in construction capital costs.

Working with open structured (granular) data simplifies information retrieval and processing, reduces dependence on specialized BIM platforms, and opens the door to automation without the need to use proprietary systems or parametric and complex data models from CAD formats.

.

Change language

Post's Highlights

Stay updated: news and insights


We’re Here to Help

Fresh solutions are released through our social channels

Leave a Reply

Your email address will not be published. Required fields are marked *

Focus Areas

navigate
  • ALL THE CHAPTERS IN THIS PART
  • A PRACTICAL GUIDE TO IMPLEMENTING A DATA-DRIVEN APPROACH (8)
  • CLASSIFICATION AND INTEGRATION: A COMMON LANGUAGE FOR CONSTRUCTION DATA (8)
  • DATA FLOW WITHOUT MANUAL EFFORT: WHY ETL (8)
  • DATA INFRASTRUCTURE: FROM STORAGE FORMATS TO DIGITAL REPOSITORIES (8)
  • DATA UNIFICATION AND STRUCTURING (7)
  • SYSTEMATIZATION OF REQUIREMENTS AND VALIDATION OF INFORMATION (7)
  • COST CALCULATIONS AND ESTIMATES FOR CONSTRUCTION PROJECTS (6)
  • EMERGENCE OF BIM-CONCEPTS IN THE CONSTRUCTION INDUSTRY (6)
  • MACHINE LEARNING AND PREDICTIONS (6)
  • BIG DATA AND ITS ANALYSIS (5)
  • DATA ANALYTICS AND DATA-DRIVEN DECISION-MAKING (5)
  • DATA CONVERSION INTO A STRUCTURED FORM (5)
  • DESIGN PARAMETERIZATION AND USE OF LLM FOR CAD OPERATION (5)
  • GEOMETRY IN CONSTRUCTION: FROM LINES TO CUBIC METERS (5)
  • LLM AND THEIR ROLE IN DATA PROCESSING AND BUSINESS PROCESSES (5)
  • ORCHESTRATION OF ETL AND WORKFLOWS: PRACTICAL SOLUTIONS (5)
  • SURVIVAL STRATEGIES: BUILDING COMPETITIVE ADVANTAGE (5)
  • 4D-6D and Calculation of Carbon Dioxide Emissions (4)
  • CONSTRUCTION ERP AND PMIS SYSTEMS (4)
  • COST AND SCHEDULE FORECASTING USING MACHINE LEARNING (4)
  • DATA WAREHOUSE MANAGEMENT AND CHAOS PREVENTION (4)
  • EVOLUTION OF DATA USE IN THE CONSTRUCTION INDUSTRY (4)
  • IDE WITH LLM SUPPORT AND FUTURE PROGRAMMING CHANGES (4)
  • QUANTITY TAKE-OFF AND AUTOMATIC CREATION OF ESTIMATES AND SCHEDULES (4)
  • THE DIGITAL REVOLUTION AND THE EXPLOSION OF DATA (4)
  • Uncategorized (4)
  • CLOSED PROJECT FORMATS AND INTEROPERABILITY ISSUES (3)
  • MANAGEMENT SYSTEMS IN CONSTRUCTION (3)
  • AUTOMATIC ETL CONVEYOR (PIPELINE) (2)

Search

Search

057 Speed of decision making depends on data quality

Today’s design data architecture is undergoing fundamental changes. The industry is moving away from bulky, isolated models and closed formats towards more flexible, machine-readable structures focused on analytics, integration and process automation. However, the transition...

060 A common language of construction the role of classifiers in digital transformation

In the context of digitalization and automation of inspection and processing processes, a special role is played by classification systems elements – a kind of “digital dictionaries” that ensure uniformity in the description and parameterization...

061 Masterformat, OmniClass, Uniclass and CoClass the evolution of classification systems

Historically, construction element and work classifiers have evolved in three generations, each reflecting the level of available technology and the current needs of the industry in a particular time period (Fig. 4.2-8): First generation (early...

Don't miss the new solutions


Linux

macOS

Looking for the Linux or MAC version? Send us a quick message using the button below, and we’ll guide you through the process!


📥 Download OnePager

Welcome to DataDrivenConstruction—where data meets innovation in the construction industry. Our One-Pager offers a concise overview of how our data-driven solutions can transform your projects, enhance efficiency, and drive sustainable growth. 

🚀 Welcome to the future of data in construction!

You're taking your first step into the world of open data, working with normalized, structured data—the foundation of data analytics and modern automation tools.

By downloading, you agree to the DataDrivenConstruction terms of use 

Stay ahead with the latest updates on converters, tools, AI, LLM
and data analytics in construction — Subscribe now!

🚀 Welcome to the future of data in construction!

You're taking your first step into the world of open data, working with normalized, structured data—the foundation of data analytics and modern automation tools.

By downloading, you agree to the DataDrivenConstruction terms of use 

Stay ahead with the latest updates on converters, tools, AI, LLM
and data analytics in construction — Subscribe now!

🚀 Welcome to the future of data in construction!

You're taking your first step into the world of open data, working with normalized, structured data—the foundation of data analytics and modern automation tools.

By downloading, you agree to the DDC terms of use 

🚀 Welcome to the future of data in construction!

You're taking your first step into the world of open data, working with normalized, structured data—the foundation of data analytics and modern automation tools.

By downloading, you agree to the DataDrivenConstruction terms of use 

Stay ahead with the latest updates on converters, tools, AI, LLM
and data analytics in construction — Subscribe now!

DataDrivenConstruction offers workshops tested and practiced on global leaders in the construction industry to help your team navigate and leverage the power of data and artificial intelligence in your company's decision making.

Reserve your spot now to rethink your
approach to decision making!

Please enable JavaScript in your browser to complete this form.


🚀 Welcome to the future of data in construction!

By downloading, you agree to the DataDrivenConstruction terms of use 

Stay ahead with the latest updates on converters, tools, AI, LLM
and data analytics in construction — Subscribe now!

Have a question or need more information? Reach out to us directly!
Schedule a time to discuss your needs with our team.
Tailored sessions to help your team grow — let's plan together!
Have you attended one of our workshops, read our book, or used our solutions? Share your thoughts with us!
Please enable JavaScript in your browser to complete this form.
Name
Data Maturity Diagnostics

🧰 Data-Driven Readiness Check

This short assessment will help you identify your company's data management pain points and offer solutions to improve project efficiency. It takes only 1–2 minutes to complete and you will receive personalized recommendations tailored to your needs.

🚀 Goals and Pain Points

What are your biggest obstacles today — and your goals for the next 6 months? We’ll use your answers to build a personalized roadmap.

Build your automation pipeline

 Understand and organize your data

Automate your key process

Define a digital strategy

Move from CAD (BIM) to databases and analytics

Combine BIM, ERP and Excel

Convince leadership to invest in data

📘  What to Read in Data-Driven Construction Guidebook

Chapters 1.2, 4.1–4.3 – Technologies, Data Conversion, Structuring, Modeling:

  • Centralized vs fragmented data

  • Principles of data structure

  • Roles of Excel, DWH, and databases

Chapters 5.2, 7.2 – QTO Automation, ETL with Python:

  • Data filtering and grouping

  • Automating QTO and quantity takeoff

  • Python scripts and ETL logic

Chapter 10.2 – Roadmap for Digital Transformation:

  • Strategic stages of digital change

  • Organizational setup

  • Prioritization and execution paths

Chapters 4.1, 8.1–8.2 – From CAD (BIM) to Storage & Analytics:

  • Translating Revit/IFC to structured tables

  • BIM as a database

  • Building analytical backends

Chapters 7.3, 10.2 – Building ETL Pipelines + Strategic Integration:

  • Combining Excel, BIM, ERP

  • Automating flows between tools

  • Connecting scattered data sources

Chapters 7.3, 7.4 – ETL Pipelines and Orchestration (Airflow, n8n):

  • Building pipelines

  • Scheduling jobs

  • Using tools like Airflow or n8n to control the flow 

Chapters 2.1, 10.1 – Fragmentation, ROI, Survival Strategy:

  • Hidden costs of bad data

  • Risk of inaction

  • ROI of data initiatives

  • Convincing stakeholders

Download the DDC Guidebook for Free


🎯 DDC Workshop That Solves Your Puzzle

Module 1 – Data Automation and Workflows in Construction:
  • Overview of data sources
  • Excel vs systems
  • Typical data flows in construction
  • Foundational data logic

Module 3 – Automated Data Processing Workflow:
  • Setting up ETL workflows
  • CAD/BIM extraction
  • Automation in Excel/PDF reporting

Module 8 – Converting Unstructured CAD into Structured Formats 
  • From IFC/Revit to tables
  • Geometric vs semantic data
  • Tools for parsing and transforming CAD models

Module 13 – Key Stages of Transformation 
  • Transformation roadmap
  • Change management
  • Roles and responsibilities
  • KPIs and success metrics

Module 8 – Integrating Diverse Data Systems and Formats
  • Excel, ERP, BIM integration
  • Data connection and file exchange
  • Structuring hybrid pipelines

Module 7 – Automating Data Quality Assurance Processes 
  • Rules and checks
  • Dashboards
  • Report validation
  • Automated exception handling

Module 10 – Challenges of Digitalization in the Industry 
  • How to justify investment in data
  • Stakeholder concerns
  • ROI examples
  • Failure risks

💬 Individual Consultation – What We'll Discuss

Audit of your data landscape 

We'll review how data is stored and shared in your company and identify key improvement areas.

Select a process for automation 

We'll pick one process in your company that can be automated and outline a step-by-step plan.

Strategic roadmap planning 

Together we’ll map your digital transformation priorities and build a realistic roadmap.

CAD (BIM) - IFC/Revit model review 

We'll review your Revit/IFC/DWG data and show how to convert it into clean, structured datasets.

Mapping integrations across tools 

We’ll identify your main data sources and define how they could be connected into one workflow.

Plan a pilot pipeline (PoC) 

We'll plan a pilot pipeline: where to start, what tools to use, and what benefits to expect.

ROI and stakeholder alignment 

📬 Get Your Personalized Report and Next Steps

You’ve just taken the first step toward clarity. But here’s the uncomfortable truth: 🚨 Most companies lose time and money every week because they don't know what their data is hiding. Missed deadlines, incorrect reports, disconnected teams — all symptoms of a silent data chaos that gets worse the longer it's ignored.

Please enter your contact details so we can send you your customized recommendations and next-step options tailored to your goals.

💡 What you’ll get next:

  • A tailored action plan based on your answers

  • A list of tools and strategies to fix what’s slowing you down

  • An invite to a free 1:1 session to discuss your case

  • And if you choose: a prototype (PoC) to show how your process could be automated — fast.

082 QTO Quantity Take-Off grouping project data by attributes
This website uses cookies to improve your experience. By using this website you agree to our Data Protection Policy.
Read more
×