
After the steps of collecting, structuring, cleaning and verifying the information, a coherent and analyzable data set has been formed. The previous parts of the book covered the systematization and structuring of heterogeneous sources – from PDF documents and text records of meetings to CAD models and geometric data. The process of checking and aligning information with the requirements of various systems and classifiers, eliminating duplicates and inconsistencies is described in detail.
All the calculations performed on this data (third, fourth parts of the book) – from simple transformations to calculations of time, cost, and ESG metrics (fifth part) – are aggregated analytics tasks. They form the basis for understanding the current state of a project, evaluating its parameters, and then making decisions. As a result, the data, as a result of calculations, turns from a set of disparate records into a manageable resource capable of answering key business questions.
The previous chapters have detailed the data collection and quality control processes for use in typical business cases and processes specific to the construction industry. Analytics in this context is in many ways similar to applications in other industries, but it also has a number of specific features.
In the following chapters, an enlarged data analysis process will be discussed in detail, including the stages of automation – from the initial acquisition of information and its transformation to its subsequent transfer to target systems and documents. First, a theoretical part will be presented, focusing on selected aspects of data-driven decision making. Then, in the following chapters, the practical part related to automation and building ETL -Pipeline will begin.
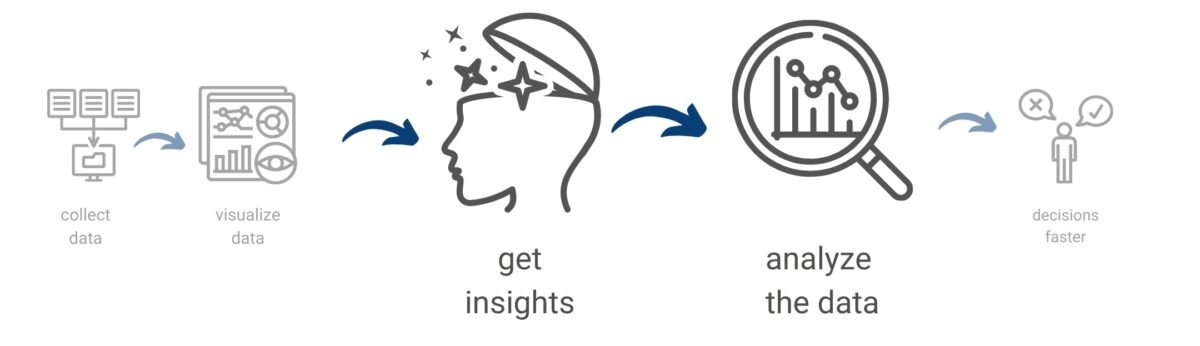
Data-driven decision-making is often an iterative process and begins with the systematic collection of information from a variety of information sources. Like nature’s cycle, individual data elements and entire information systems gradually fall into the soil – accumulating in companies’ information repositories (Fig. 1.3-2). Over time, this data, like fallen leaves and branches, is transformed into valuable material. The mycelium of data engineers and analysts organizes and prepares information for future use and turns fallen data and systems into valuable compost, to grow new shoots and new systems (Fig. 1.2-5).
Trends in the widespread use of analytics in various industries, marks the beginning of a new era, where working with data becomes the basis of professional activity (Fig. 7.1-1). It is important for construction industry professionals to adapt to these changes and be prepared to move into a new era – the era of data and analytics
Manually moving data between tables and performing calculations manually are gradually becoming a thing of the past, giving way to automation, data flow analysis, analytics and machine learning. These tools are becoming key elements of modern decision support systems.
In McKinsey’s book “Rebooting. McKinsey’s Guide to Overcoming Competition in the Age of Digital Technology and Artificial Intelligence“ (McKinsey, “The McKinsey guide to outcompeting in the age of digital and AI,” 2023) cites a study of 1,330 senior executives from various regions, industries, and functional areas in 2022 (McKinsey, “The McKinsey guide to outcompeting in the age of digital and AI,” 2023), cites a study conducted in 2022 with 1,330 senior executives from different regions, industries, and functional areas. According to its results, 70% of leaders use advanced analytics to generate their own ideas, and 50% implement artificial intelligence to improve and automate decision-making processes.

Data analytics, like the spreading of mycelium, penetrates the humus of past decisions, helping to connect individual systems and guiding managers to valuable insights. This knowledge, like nutrients from decayed data system trees, feeds new decisions in the company, leading to effective change and quality information growth, like new shoots and sprouts emerging from rich and healthy soil (Fig. 1.2-5).
Numbers have an important story to tell. They are counting on you to give them a clear and compelling voice (Forbes, “Data Storytelling: The Essential Data Science Skill Everyone Needs,” March 31, 2016).
– Stephen Few, Data Visualization Expert
In medium-sized and small companies, the work of extracting and preparing information for further analysis is today an extremely labor-intensive process (Fig. 7.1-2), comparable to eighteenth-century coal mining. Until recently, the work of data mining and preparation was rather reserved for adventurers working in a highly specialized niche with a small and limited set of tools for working with different types of data from unstructured, loosely structured, mixed and closed sources.
Decision makers and managers are often inexperienced with heterogeneous data and systems, yet need to make data-driven decisions. As a result, data-driven decision making in the modern construction industry over the past decades has felt less like an automated process and more like the multi-day manual labor of a miner in the early coal mines.

While modern methods of data extraction in the construction industry are certainly more advanced than the primitive techniques of 12th century miners, it is still a complex and high-risk task that requires significant resources and expertise that only large companies could afford. The processes of extracting and analyzing data from the accumulated legacy of past projects have until recently been predominantly handled by large, technologically advanced companies that have been collecting and storing data consistently for decades
Previously, the leading role in analytics was played by technologically mature companies that had been accumulating data for decades. Today, the situation is changing: access to data and data processing tools is becoming democratic – previously complex solutions are now available to everyone for free.
Applying analytics allows companies to make more accurate and informed decisions in real time. The following case study illustrates how historical data can help make financially sound decisions:
Project Manager – “Now the average price of concrete in the city is 82€ /m³, we have 95 €/m³ in the estimate.”
Estimator – “On previous projects the cost overrun was about 15%, so I backed up.”
Data manager or customer-side control engineer – “Let’s look at the analytics for the last three tenders.”
After analyzing DataFrames from past projects, we get:
- Average actual purchase price: 84.80 /m³€
- Average overspend ratio: +4.7%
Recommended rate in the estimate: ~ 85 /m³€
Such a decision will no longer be based on subjective feelings, but on specific historical statistics, which helps to reduce risks and increase the validity of the tender bid. Analysis of data from past projects becomes a kind of “organic fertilizer” from which new, more accurate solutions germinate.

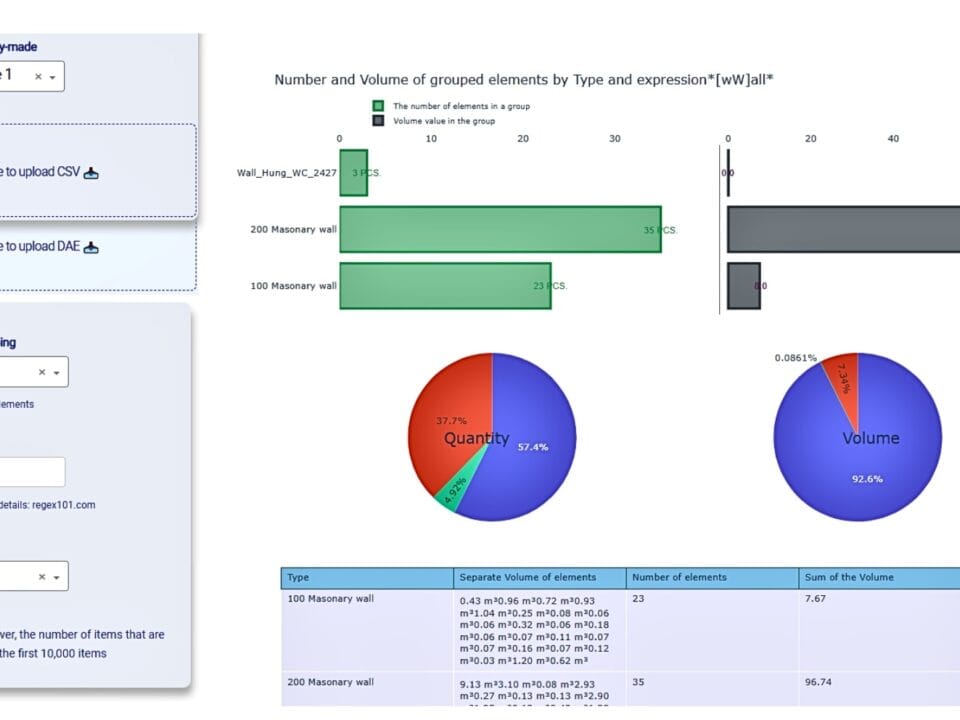
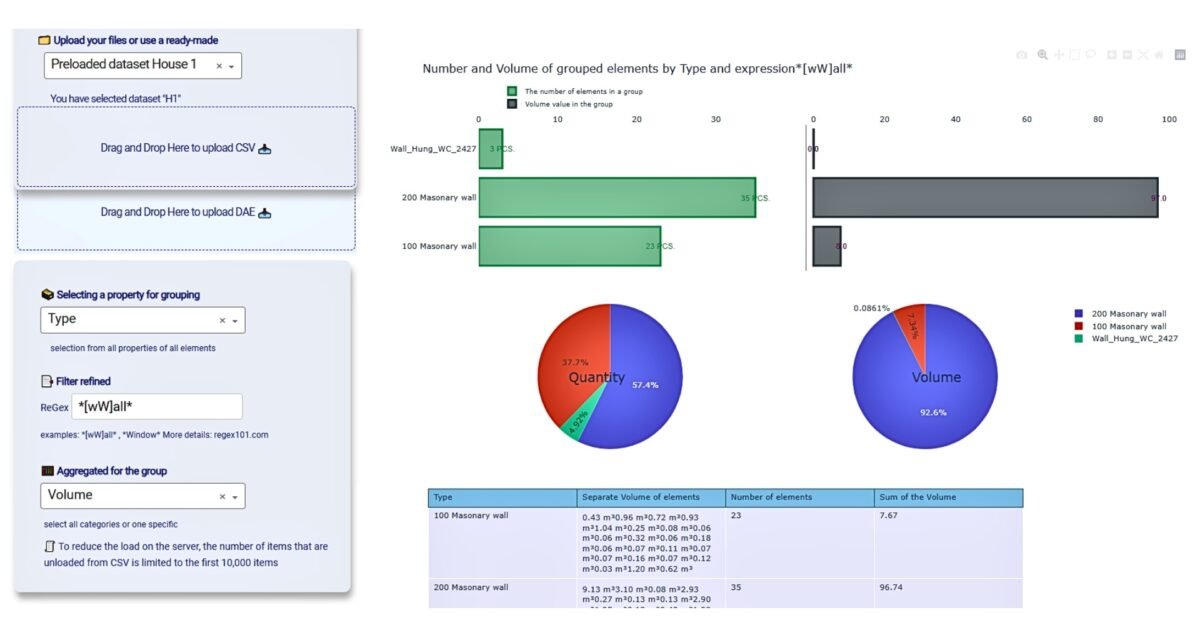
Decision makers and managers are often faced with the need to work with heterogeneous data and systems with little technical background. In such situations, visualization – one of the first and most important steps in the analytical process – becomes one of the key aids in understanding data. It allows to present information in a visual and understandable form.


