Picture 8
114 Visualizing data the key to understanding and decision making
10 June 2025
Picture 9
116 Dashboards and dashboards visualization of indicators for effective management
10 June 2025

115 KPIs and ROI

In today’s construction industry, the management of performance indicators (KPI and ROI) and their visualization through reports and dashboards play a key role in improving productivity and project management efficiency.

As in any business, in construction, it is necessary to clearly define the metrics by which success, return on investment and performance are measured. When obtaining data on various processes, a data-driven organization must first learn to identify key KPIs (Key Performance Indicators) – quantitative measures that reflect the extent to which strategic and operational goals are being achieved.

To calculate a KPI, a formula is usually used (Fig. 7.1-5) that includes actual and planned indicators. For example, to calculate an individual KPI for a project, employee or process, divide the actual performance by the planned performance and multiply the result by 100%.

.

image65
Fig. 7.1-5 KPIs are used to measure the success of a project or process in achieving key objectives.

At the construction site level, more detailed KPI metrics can be used:

  • Timing of key milestones (foundation, installation, finishing) – allows you to monitor compliance with work plans.
  • Material Overrun Percentage – helps to manage purchases and minimize wastage.
  • Number of unscheduled machine downtimes – affects productivity and costs.

Choosing the wrong metrics can lead to erroneous “what to do?” decisions (Fig. 2.2-5). For example, if a company focuses only on cost per square meter but does not consider the cost of remodeling, savings on materials can lead to poorer quality and higher costs in future projects.

When setting objectives, it is important to be clear about what is being measured. Vague wording leads to incorrect conclusions and complicates control. Let’s look at examples of successful and unsuccessful KPIs in construction.

Good KPIs:

“By the end of the year, reduce the percentage of reworked finishes by 10%.”

“Increase the speed of façade installation by 15% without compromising quality by next quarter”

“Reduce equipment downtime by 20% by optimizing work schedules by year-end”

These metrics are clearly measurable, have specific values and timeframes.

Bad KPIs:

We will build faster” (How much faster? What does “faster” mean?)

“We will improve the quality of concrete work” (How exactly is quality measured?)

“We will improve contractor interaction at the site” (What criteria will show improvement?)

A good KPI is one that can be measured and objectively assessed. In construction, this is especially important, because without clear indicators it is impossible to monitor performance and achieve stable results.

In addition to KPI, there is an additional metric for assessing the effectiveness of investments: ROI (Return on Investment) – a return on investment indicator that reflects the ratio between profit and invested funds. ROI allows you to assess whether the implementation of new methods, technologies or tools is justified: from digital solutions and automation (e.g. Fig. 7.3-2) to the use of new building materials. This indicator helps to make informed decisions about further investments based on their real impact on business profitability

In the context of construction project management, ROI (return on investment) can be used as one of the key performance indicators (KPI) if a company’s goal is to measure the return on investment of a project, technology or process improvement. For example, if a new construction management technique is being implemented, ROI can show how much it has improved profitability.

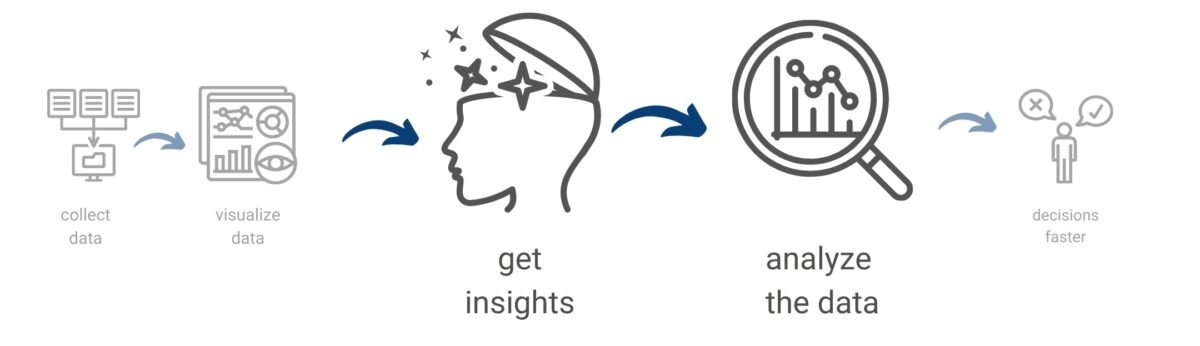
Regularly measuring KPIs and ROIs based on data collected from various sources, such as material consumption, labor hours and costs, allows project management to effectively manage resources and make quick decisions. Storing this data for the long term allows for analyzing future trends and optimizing processes.

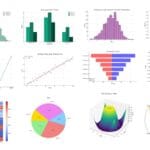
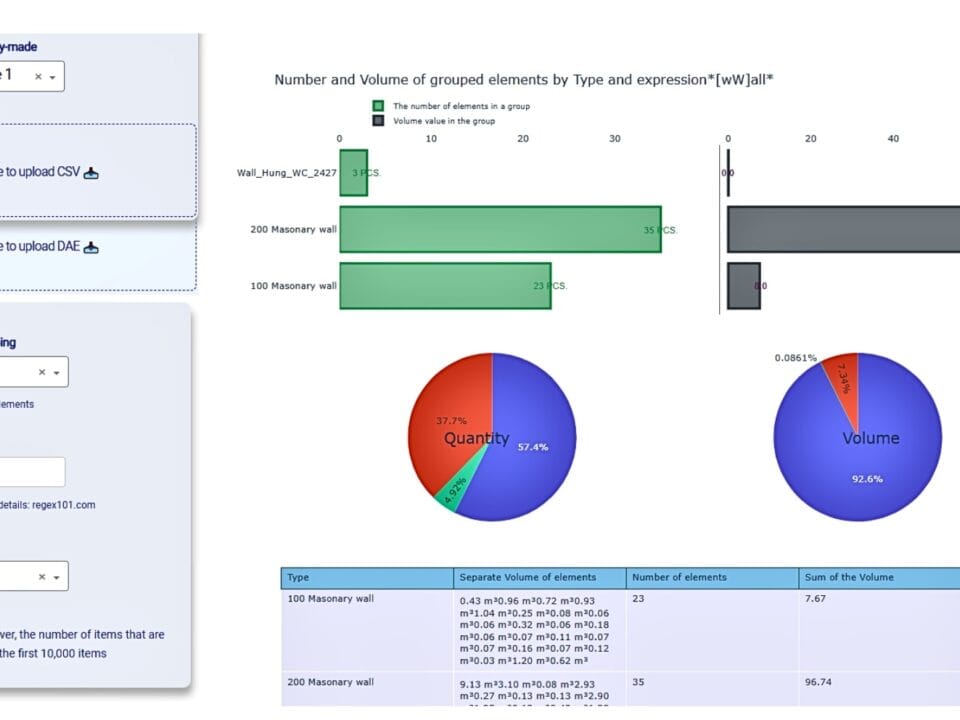
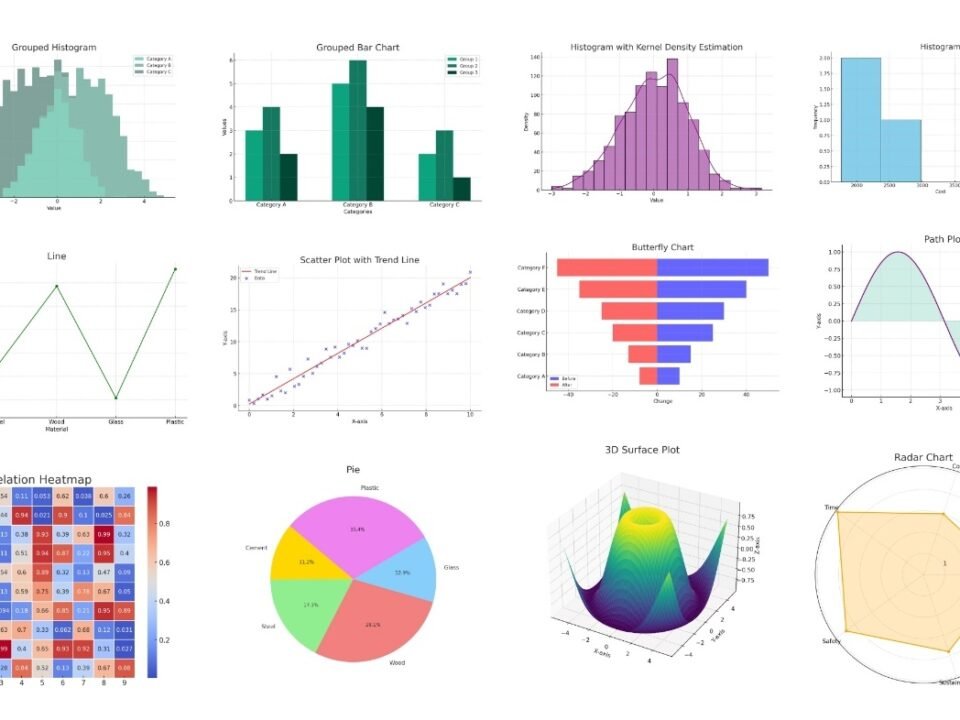
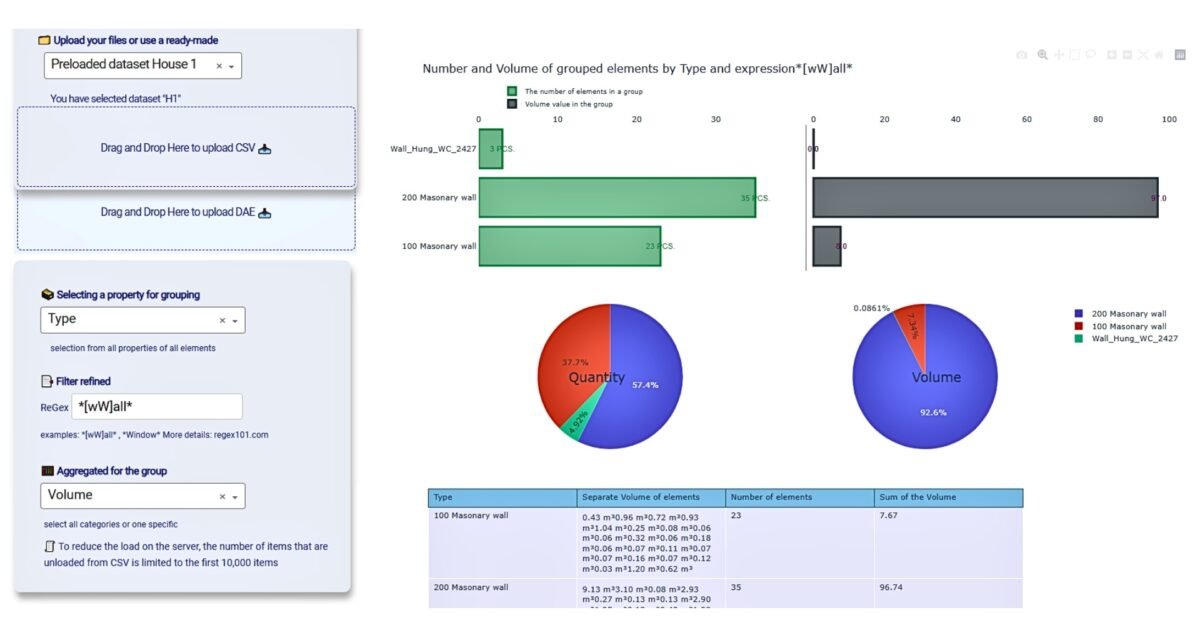
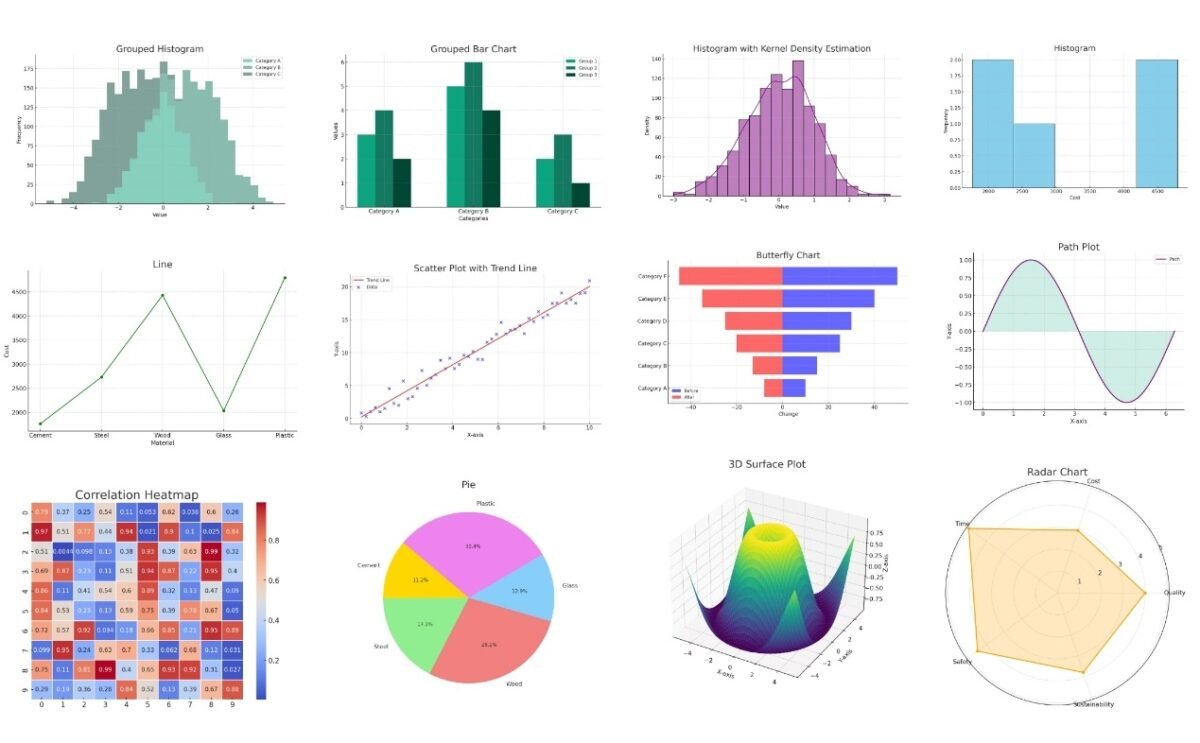
Various charts and graphs are used to visualize KPIs, ROIs, and other metrics and are usually combined into dashboards.

.

Leave a Reply

Change language

Post's Highlights

Stay updated: news and insights


We’re Here to Help

Fresh solutions are released through our social channels

UNLOCK THE POWER OF DATA
 IN CONSTRUCTION

Dive into the world of data-driven construction with this accessible guide, perfect for professionals and novices alike.
From the basics of data management to cutting-edge trends in digital transformation, this book
will be your comprehensive guide to using data in the construction industry.

Related posts 

Focus Areas

navigate
  • ALL THE CHAPTERS IN THIS PART
  • A PRACTICAL GUIDE TO IMPLEMENTING A DATA-DRIVEN APPROACH (8)
  • CLASSIFICATION AND INTEGRATION: A COMMON LANGUAGE FOR CONSTRUCTION DATA (8)
  • DATA FLOW WITHOUT MANUAL EFFORT: WHY ETL (8)
  • DATA INFRASTRUCTURE: FROM STORAGE FORMATS TO DIGITAL REPOSITORIES (8)
  • DATA UNIFICATION AND STRUCTURING (7)
  • SYSTEMATIZATION OF REQUIREMENTS AND VALIDATION OF INFORMATION (7)
  • COST CALCULATIONS AND ESTIMATES FOR CONSTRUCTION PROJECTS (6)
  • EMERGENCE OF BIM-CONCEPTS IN THE CONSTRUCTION INDUSTRY (6)
  • MACHINE LEARNING AND PREDICTIONS (6)
  • BIG DATA AND ITS ANALYSIS (5)
  • DATA ANALYTICS AND DATA-DRIVEN DECISION-MAKING (5)
  • DATA CONVERSION INTO A STRUCTURED FORM (5)
  • DESIGN PARAMETERIZATION AND USE OF LLM FOR CAD OPERATION (5)
  • GEOMETRY IN CONSTRUCTION: FROM LINES TO CUBIC METERS (5)
  • LLM AND THEIR ROLE IN DATA PROCESSING AND BUSINESS PROCESSES (5)
  • ORCHESTRATION OF ETL AND WORKFLOWS: PRACTICAL SOLUTIONS (5)
  • SURVIVAL STRATEGIES: BUILDING COMPETITIVE ADVANTAGE (5)
  • 4D-6D and Calculation of Carbon Dioxide Emissions (4)
  • CONSTRUCTION ERP AND PMIS SYSTEMS (4)
  • COST AND SCHEDULE FORECASTING USING MACHINE LEARNING (4)
  • DATA WAREHOUSE MANAGEMENT AND CHAOS PREVENTION (4)
  • EVOLUTION OF DATA USE IN THE CONSTRUCTION INDUSTRY (4)
  • IDE WITH LLM SUPPORT AND FUTURE PROGRAMMING CHANGES (4)
  • QUANTITY TAKE-OFF AND AUTOMATIC CREATION OF ESTIMATES AND SCHEDULES (4)
  • THE DIGITAL REVOLUTION AND THE EXPLOSION OF DATA (4)
  • Uncategorized (4)
  • CLOSED PROJECT FORMATS AND INTEROPERABILITY ISSUES (3)
  • MANAGEMENT SYSTEMS IN CONSTRUCTION (3)
  • AUTOMATIC ETL CONVEYOR (PIPELINE) (2)

Search

Search

057 Speed of decision making depends on data quality

Today’s design data architecture is undergoing fundamental changes. The industry is moving away from bulky, isolated models and closed formats towards more flexible, machine-readable structures focused on analytics, integration and process automation. However, the transition...

060 A common language of construction the role of classifiers in digital transformation

In the context of digitalization and automation of inspection and processing processes, a special role is played by classification systems elements – a kind of “digital dictionaries” that ensure uniformity in the description and parameterization...

061 Masterformat, OmniClass, Uniclass and CoClass the evolution of classification systems

Historically, construction element and work classifiers have evolved in three generations, each reflecting the level of available technology and the current needs of the industry in a particular time period (Fig. 4.2-8): First generation (early...

Don't miss the new solutions


Linux

macOS

Looking for the Linux or MAC version? Send us a quick message using the button below, and we’ll guide you through the process!


📥 Download OnePager

Welcome to DataDrivenConstruction—where data meets innovation in the construction industry. Our One-Pager offers a concise overview of how our data-driven solutions can transform your projects, enhance efficiency, and drive sustainable growth. 

🚀 Welcome to the future of data in construction!

You're taking your first step into the world of open data, working with normalized, structured data—the foundation of data analytics and modern automation tools.

By downloading, you agree to the DataDrivenConstruction terms of use 

Stay ahead with the latest updates on converters, tools, AI, LLM
and data analytics in construction — Subscribe now!

🚀 Welcome to the future of data in construction!

You're taking your first step into the world of open data, working with normalized, structured data—the foundation of data analytics and modern automation tools.

By downloading, you agree to the DataDrivenConstruction terms of use 

Stay ahead with the latest updates on converters, tools, AI, LLM
and data analytics in construction — Subscribe now!

🚀 Welcome to the future of data in construction!

You're taking your first step into the world of open data, working with normalized, structured data—the foundation of data analytics and modern automation tools.

By downloading, you agree to the DDC terms of use 

🚀 Welcome to the future of data in construction!

You're taking your first step into the world of open data, working with normalized, structured data—the foundation of data analytics and modern automation tools.

By downloading, you agree to the DataDrivenConstruction terms of use 

Stay ahead with the latest updates on converters, tools, AI, LLM
and data analytics in construction — Subscribe now!

DataDrivenConstruction offers workshops tested and practiced on global leaders in the construction industry to help your team navigate and leverage the power of data and artificial intelligence in your company's decision making.

Reserve your spot now to rethink your
approach to decision making!

Please enable JavaScript in your browser to complete this form.


🚀 Welcome to the future of data in construction!

By downloading, you agree to the DataDrivenConstruction terms of use 

Stay ahead with the latest updates on converters, tools, AI, LLM
and data analytics in construction — Subscribe now!

Have a question or need more information? Reach out to us directly!
Schedule a time to discuss your needs with our team.
Tailored sessions to help your team grow — let's plan together!
Have you attended one of our workshops, read our book, or used our solutions? Share your thoughts with us!
Please enable JavaScript in your browser to complete this form.
Name
Data Maturity Diagnostics

🧰 Data-Driven Readiness Check

This short assessment will help you identify your company's data management pain points and offer solutions to improve project efficiency. It takes only 1–2 minutes to complete and you will receive personalized recommendations tailored to your needs.

🚀 Goals and Pain Points

What are your biggest obstacles today — and your goals for the next 6 months? We’ll use your answers to build a personalized roadmap.

Build your automation pipeline

 Understand and organize your data

Automate your key process

Define a digital strategy

Move from CAD (BIM) to databases and analytics

Combine BIM, ERP and Excel

Convince leadership to invest in data

📘  What to Read in Data-Driven Construction Guidebook

Chapters 1.2, 4.1–4.3 – Technologies, Data Conversion, Structuring, Modeling:

  • Centralized vs fragmented data

  • Principles of data structure

  • Roles of Excel, DWH, and databases

Chapters 5.2, 7.2 – QTO Automation, ETL with Python:

  • Data filtering and grouping

  • Automating QTO and quantity takeoff

  • Python scripts and ETL logic

Chapter 10.2 – Roadmap for Digital Transformation:

  • Strategic stages of digital change

  • Organizational setup

  • Prioritization and execution paths

Chapters 4.1, 8.1–8.2 – From CAD (BIM) to Storage & Analytics:

  • Translating Revit/IFC to structured tables

  • BIM as a database

  • Building analytical backends

Chapters 7.3, 10.2 – Building ETL Pipelines + Strategic Integration:

  • Combining Excel, BIM, ERP

  • Automating flows between tools

  • Connecting scattered data sources

Chapters 7.3, 7.4 – ETL Pipelines and Orchestration (Airflow, n8n):

  • Building pipelines

  • Scheduling jobs

  • Using tools like Airflow or n8n to control the flow 

Chapters 2.1, 10.1 – Fragmentation, ROI, Survival Strategy:

  • Hidden costs of bad data

  • Risk of inaction

  • ROI of data initiatives

  • Convincing stakeholders

Download the DDC Guidebook for Free


🎯 DDC Workshop That Solves Your Puzzle

Module 1 – Data Automation and Workflows in Construction:
  • Overview of data sources
  • Excel vs systems
  • Typical data flows in construction
  • Foundational data logic

Module 3 – Automated Data Processing Workflow:
  • Setting up ETL workflows
  • CAD/BIM extraction
  • Automation in Excel/PDF reporting

Module 8 – Converting Unstructured CAD into Structured Formats 
  • From IFC/Revit to tables
  • Geometric vs semantic data
  • Tools for parsing and transforming CAD models

Module 13 – Key Stages of Transformation 
  • Transformation roadmap
  • Change management
  • Roles and responsibilities
  • KPIs and success metrics

Module 8 – Integrating Diverse Data Systems and Formats
  • Excel, ERP, BIM integration
  • Data connection and file exchange
  • Structuring hybrid pipelines

Module 7 – Automating Data Quality Assurance Processes 
  • Rules and checks
  • Dashboards
  • Report validation
  • Automated exception handling

Module 10 – Challenges of Digitalization in the Industry 
  • How to justify investment in data
  • Stakeholder concerns
  • ROI examples
  • Failure risks

💬 Individual Consultation – What We'll Discuss

Audit of your data landscape 

We'll review how data is stored and shared in your company and identify key improvement areas.

Select a process for automation 

We'll pick one process in your company that can be automated and outline a step-by-step plan.

Strategic roadmap planning 

Together we’ll map your digital transformation priorities and build a realistic roadmap.

CAD (BIM) - IFC/Revit model review 

We'll review your Revit/IFC/DWG data and show how to convert it into clean, structured datasets.

Mapping integrations across tools 

We’ll identify your main data sources and define how they could be connected into one workflow.

Plan a pilot pipeline (PoC) 

We'll plan a pilot pipeline: where to start, what tools to use, and what benefits to expect.

ROI and stakeholder alignment 

📬 Get Your Personalized Report and Next Steps

You’ve just taken the first step toward clarity. But here’s the uncomfortable truth: 🚨 Most companies lose time and money every week because they don't know what their data is hiding. Missed deadlines, incorrect reports, disconnected teams — all symptoms of a silent data chaos that gets worse the longer it's ignored.

Please enter your contact details so we can send you your customized recommendations and next-step options tailored to your goals.

💡 What you’ll get next:

  • A tailored action plan based on your answers

  • A list of tools and strategies to fix what’s slowing you down

  • An invite to a free 1:1 session to discuss your case

  • And if you choose: a prototype (PoC) to show how your process could be automated — fast.

Clean & Organized Data

Theoretical Chapters:

Practical Chapters:

What You'll Find on
DDC Solutions:

  • CAD/BIM to spreadsheet/database converters (Revit, AutoCAD, IFC, Microstation)
  • Ready-to-deploy n8n workflows for construction processes
  • ETL pipelines for data synchronization between systems
  • Customizable Python scripts for repetitive tasks
  • Intelligent data validation and error detection
  • Real-time dashboard connectors
  • Automated reporting systems

Connect Everything

Theoretical Chapters:

Practical Chapters:

What You'll Find on
DDC Solutions:

  • CAD/BIM to spreadsheet/database converters (Revit, AutoCAD, IFC, Microstation)
  • Ready-to-deploy n8n workflows for construction processes
  • ETL pipelines for data synchronization between systems
  • Customizable Python scripts for repetitive tasks
  • Intelligent data validation and error detection
  • Real-time dashboard connectors
  • Automated reporting systems

Add AI & LLM Brain

Theoretical Chapters:

Practical Chapters:

What You'll Find on
DDC Solutions:

  • CAD/BIM to spreadsheet/database converters (Revit, AutoCAD, IFC, Microstation)
  • Ready-to-deploy n8n workflows for construction processes
  • ETL pipelines for data synchronization between systems
  • Customizable Python scripts for repetitive tasks
  • Intelligent data validation and error detection
  • Real-time dashboard connectors
  • Automated reporting systems
115 KPIs and ROI
This website uses cookies to improve your experience. By using this website you agree to our Data Protection Policy.
Read more
×