
When key performance indicators (KPI) stop growing, despite the increase in data volumes and team size, company management inevitably comes to the realization of the need to automate processes. Sooner or later this realization becomes an incentive to launch complex automation, the main goal of which is to reduce the complexity of processes, speed up processing and reduce dependence on the human factor.
According to McKinsey’s study “How to Build a Data Architecture to Drive Innovation – Today and Tomorrow” (2022) (“How to build a data architecture to drive innovation-today and tomorrow,” June 3, 2020), companies using streaming data architectures gain a significant advantage because they can analyze information in real time.Streaming technologies allow direct analysis of real-time messages and the application of predictive maintenance in manufacturing through real-time analysis of sensor data.
Process simplification is automation, where traditional manual functions are replaced by algorithms and systems.
The issue of automation, or rather “minimizing the role of humans in data processing”, is an irreversible and highly sensitive process for every company. Specialists in any professional field are often hesitant to fully disclose their methods and subtleties of work to fellow optimizers, realizing the risk of losing their jobs in a rapidly evolving technological environment.
If you want to make enemies, try to change things(Oxford, “Woodrow Wilson 1856-1924,”).
– Woodrow Wilson, speech to a convention of salesmen, Detroit, 1916
Despite the obvious benefits of automation, many companies still have a high proportion of manual labor in their daily practices, especially in the area of engineering data. To illustrate the current situation, let’s look at a typical example of sequential data processing within such processes.
Manual data handling can be illustrated by the example of interaction with information obtained from CAD databases. Traditional data processing (“manual” ETL -process) in CAD (BIM) departments for creating attribute tables or creating documentation based on design data takes place in the following order (Fig. 7.2-1):
Manual Extract: the user manually opens the project – by launching the CAD application (BIM) (Fig. 7.2-1 step 1).
Verification: the next step usually involves manually running several plug-ins or auxiliary applications for data preparation and quality assessment (Fig. 7.2-1 step 2-3).
Manual transformation (Transform): after preparation, data processing begins, which requires manual operation of various software tools in which the data are prepared for upload (Fig. 7.2-1 step 4).
Manual upload (Load): manual upload of converted data to external systems, data formats and documents (Fig. 7.2-1 step 5).

Such a workflow is an example of a classic ETL -process – extraction, transformation and loading (ETL). Unlike other industries where automatic ETL pipelines have long been the standard, the construction industry is still dominated by manual labor, which slows down processes and increases costs
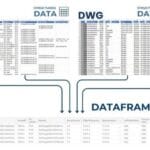
ETL (Extract, Transform, Load) is the process of extracting data from various sources, transforming it into the desired format and loading it into the target system for further analysis and use.
ETL is a process that stands for three key components of data processing: Extract, Transform, and Load (Fig. 7.2-2):
Extract – extract data from different sources (files, databases, API).
Transform – data cleaning, aggregation, normalization and logical processing.
Load – load structured information into a data warehouse, report, or BI system.
Earlier in the book, the concept of ETL was touched upon only occasionally: in the conversion of an unstructured scanned document into a structured tabular format (Fig. 4.1-1), in the context of formalizing requirements to systematize the perception of both life and business processes (Fig. 4.4-20), and in the automation of data validation and data processing from CAD solutions. Let us now look at ETL in more detail in the context of typical workflows.

Manual or semi-automated ETL -process implies a manager or technician who manages all steps manually – from data collection to report generation. Such a process takes a significant amount of time, especially when working hours are limited (e.g. 9:00 to 17:00).
Companies often seek to solve the problem of low efficiency and slow speed by purchasing modular integrated solutions (ERP, PMIS, CPM, CAFM, etc.), which are then customized by external vendors and consultants. But these vendors and third-party developers often become a critical dependency point: their technical limitations directly affect the performance of the entire system and the business as a whole, as detailed in previous chapters on proprietary systems and formats. The problems created by fragmentation and dependency were discussed in detail in the chapter “How Construction Businesses Drown in Data Chaos”.
If a company is not ready to implement a large modular platform from one of the vendors, it starts looking for alternative ways of automation. One of them is to develop their own modular open ETL -conveyors, where each stage (extraction, transformation, validation, loading) is implemented as scripts executed on a schedule.
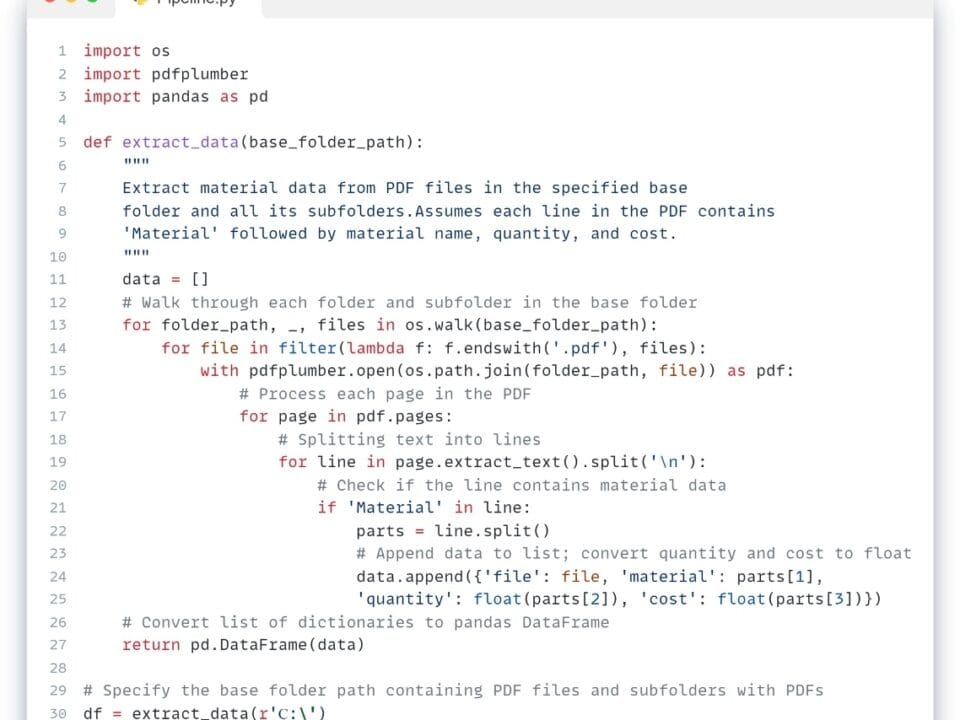
In the automated version of the same ETL workflow (Fig. 7.2-1), the work process looks like a modular code that starts with processing data and translating it into an open structured form. Once the structured data is received, various scripts or modules are run automatically, on a schedule, to check changes, transform and send messages (Fig. 7.2-3).

In an automated workflow, data processing is simplified by ET(L) data preprocessing: structuring and unification.
In traditional processing methods, specialists work with data “as is” – as it is retrieved from systems or software. In automated processes, by contrast, data often first pass through an ETL-Pipeline, where it is brought to a consistent structure and format suitable for further use and analysis.
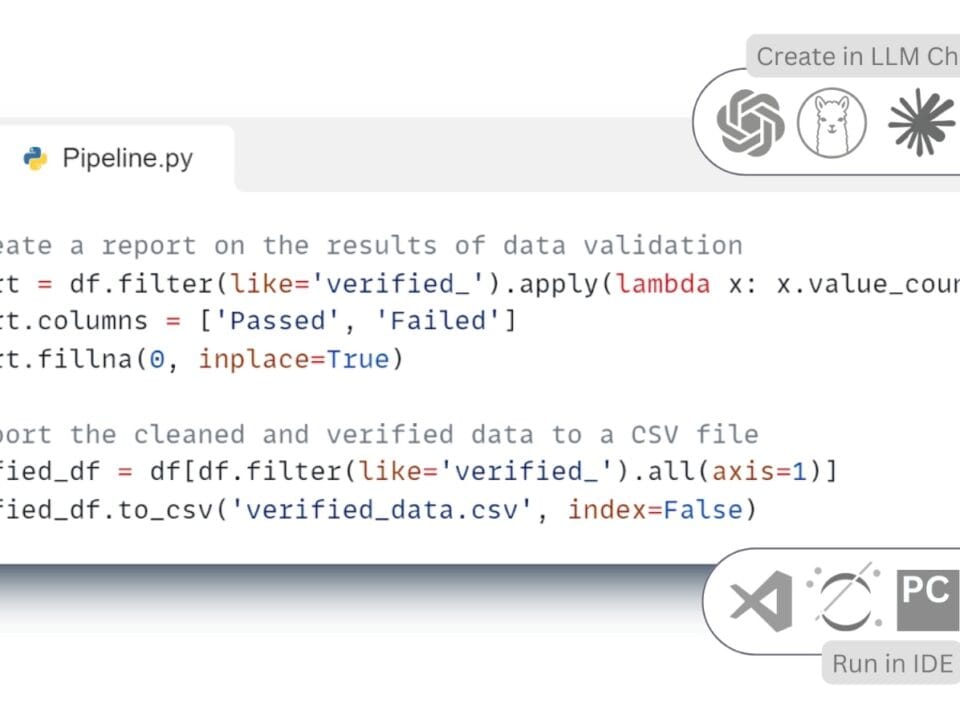
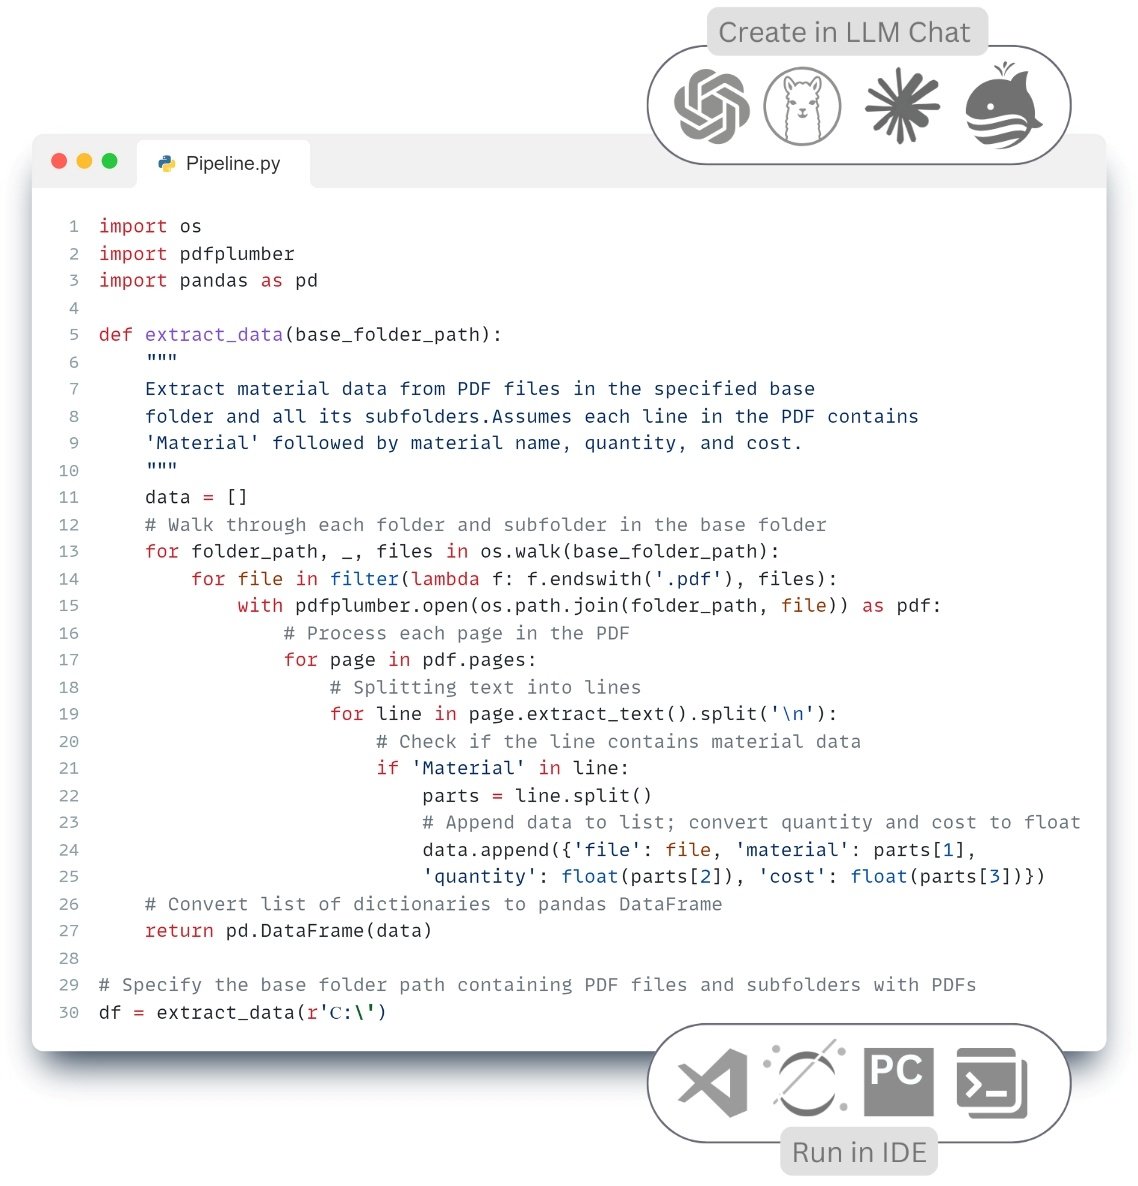
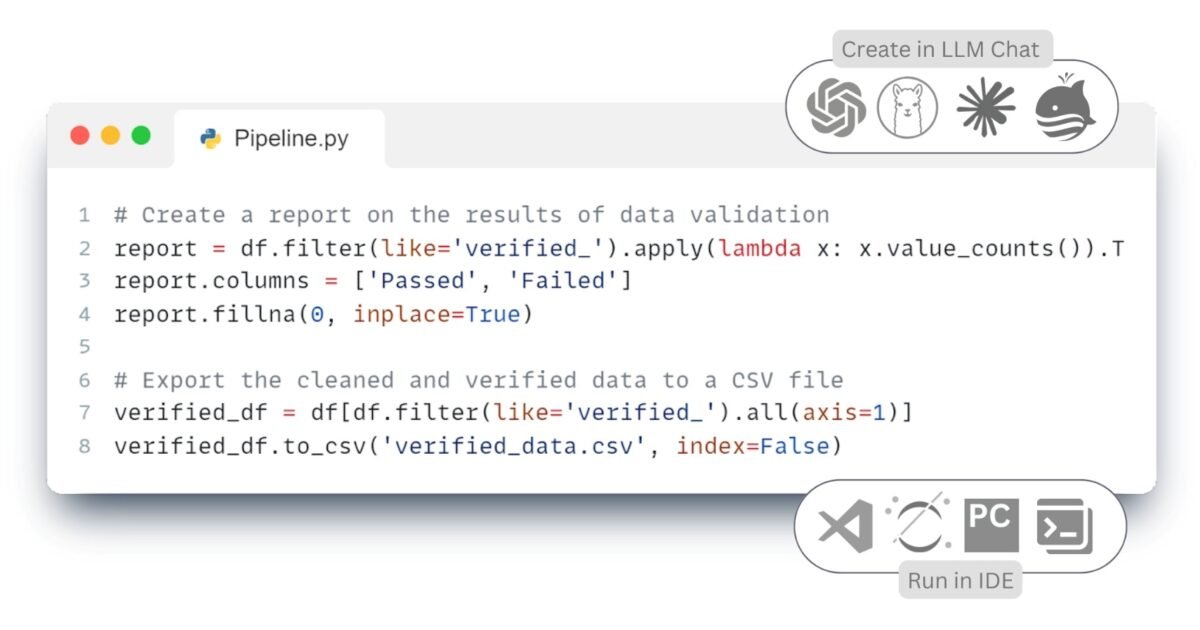
Let’s take a practical ETL example, demonstrating the data table validation process described in the chapter “Validating data and validation results” (Fig. 4.4-13). To do this, we use the Pandas library in conjunction with the LLM for automated data analysis and processing processes.


