
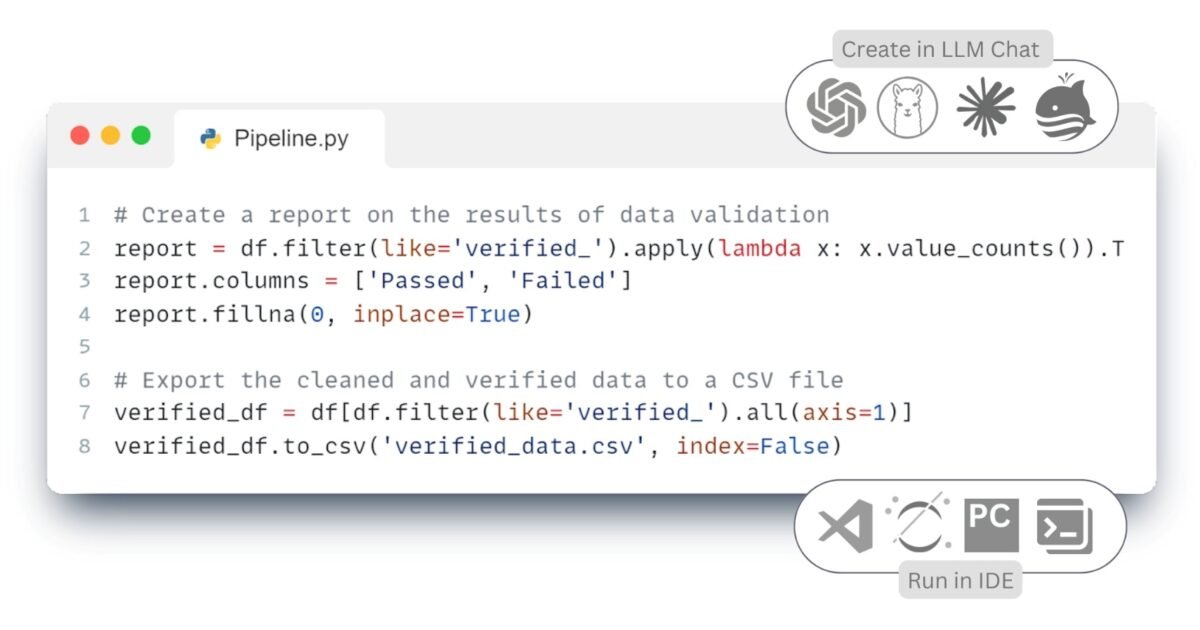
After completion of the Transform stage, when the data have been brought to a structured form and verified, the final stage – Load, where the data can be both loaded into target system and visualized for analysis. Visual presentation of data allows to promptly identify deviations, analyze distributions and communicate key conclusions to all project participants, including those with no technical background.
Instead of presenting information as tables and numbers, we can use infographics, graphs, and dashboards (dashboards). One of the most common and flexible tools for visualizing structured data in Python is the Matplotlib library (Fig. 7.2-9, Fig. 7.2-10). It allows you to create static, animated, and interactive graphs, and supports a wide range of chart types.
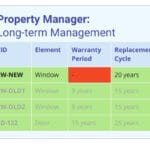
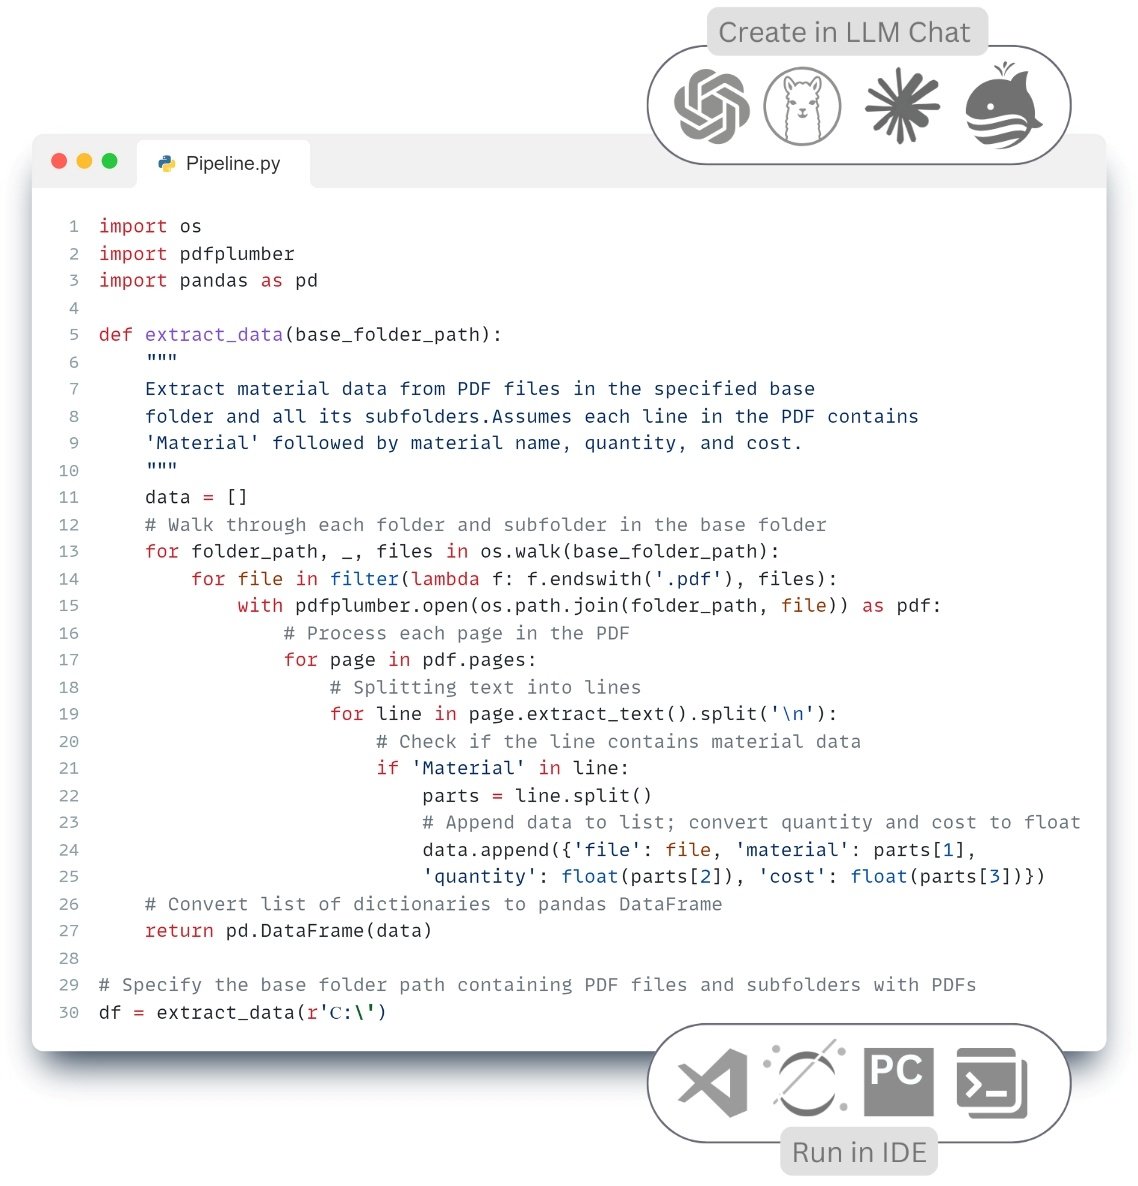
- To visualize the results of attribute checking from the RPM system (Fig. 7.2-7), you can use the following query to the language model:
Write code to visualize the DataFrame data, above (Fig. 7.2-7), with a histogram for the results to show the error rate of the attribute ⏎


- There are many open source and free visualization libraries that allow you to represent structured data in various formats. Let’s continue visualizing the results with another type of graph with the following prompt in the chat:
Depict the same data as a graph of lines ⏎
  |
There are many open source and free visualization libraries such as:
- Seaborn – for statistical graphs (Fig. 7.2-11)
- Plotly – for interactive web visualizations (Fig. 7.2-12, Fig. 7.1-6)
- Altair – for declarative visualization
- Dash or Streamlit – to create full dashboards
Knowledge of specific libraries for visualization is not necessary – modern tools, including LLM, allow you to automatically generate code for graphs and entire applications based on the task description.
The choice of tool depends on the objectives of the project: whether it is a report, a presentation or an online dashboard. For example, the open source library Seaborn is particularly good for working with categorical data, helping to identify patterns and trends.
- To see the Seaborn library in operation, you can either ask the LLM to use the desired library directly or submit a similar text request in the LLM continuation at:
Show heatmap for ⏎
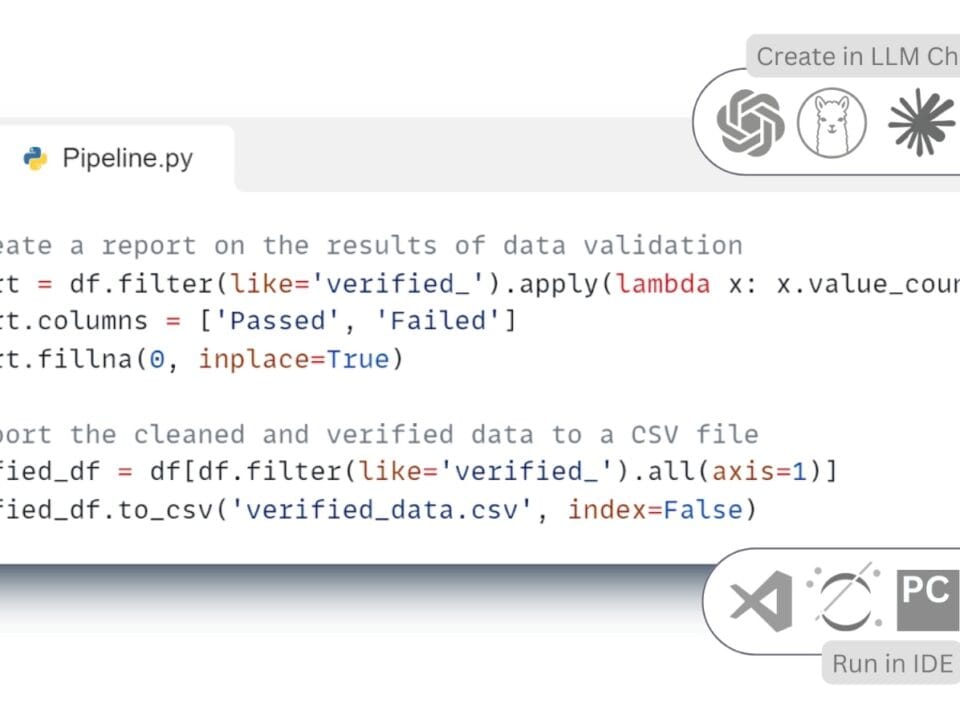
- LLM’s answer in the form of code and a finished graph, the plotting code of which can now be copied into the IDE, and the graph itself can be copied or saved for insertion into a document:


For those who prefer an interactive approach, there are tools that allow you to create dynamic charts and panels with the ability to interact. The Plotly library (Fig. 7.1-6, Fig. 7.2-12) offers the ability to create highly interactive charts and panels that can be embedded in web pages and allow the user to interact with the data in real time.

Specialized open source libraries Bokeh, Dash and Streamlit provide a convenient way to present data without requiring deep knowledge of web development. Bokeh is suitable for complex interactive graphs, Dash is used to build full-fledged analytical dashboards, and Streamlit allows you to quickly create web applications for data analysis.
With visualization tools like these, developers and analysts can effectively disseminate results to colleagues and stakeholders, enabling intuitive interaction with data and simplifying decision-making.


