Traditionally, construction was based on subjective hypotheses and personal experience. Engineers assumed – with a certain degree of probability – how the material would behave, what loads the structure would withstand and how long the project would last. These assumptions were tested in practice, often at the cost of time, resources and future risks.
With the advent of big data, the approach is changing dramatically: decisions are no longer made on the basis of intuitive guesses, but as a result of analyzing large-scale data sets. Construction is gradually ceasing to be an art of intuition and becoming a precise science of prediction.
The transition to the idea of using big data inevitably raises an important question: how critical is the amount of data and how much information is really necessary for reliable predictive analytics? The widespread belief that “the more data, the higher the accuracy” does not always prove to be statistically valid in practice.
Back in 1934, statistician Jerzy Neumann proved (J. Neyman, On the Two Different Aspects of the Representative Method: The Method of Stratified Sampling and the Method of Purposive Selection, Oxford University Press, 1934) that the key to the accuracy of statistical inference lies not so much in the amount of data as in its representativeness and randomness of sampling.
This is especially true in the construction industry, where large masses of data are collected using IoT -sensors, scanners, surveillance cameras, drones and even multi-format CAD -models, increasing the risk of blind spots, outliers and data distortions.
Let’s consider an example of road pavement condition monitoring. A complete data set of all road segments may take X GB and take about a day to process. At the same time, a random sample including only every 50th road section will take only X/50 GB and will be processed in half an hour, while providing similar accuracy of estimates for certain calculations (Fig. 9.1-1).
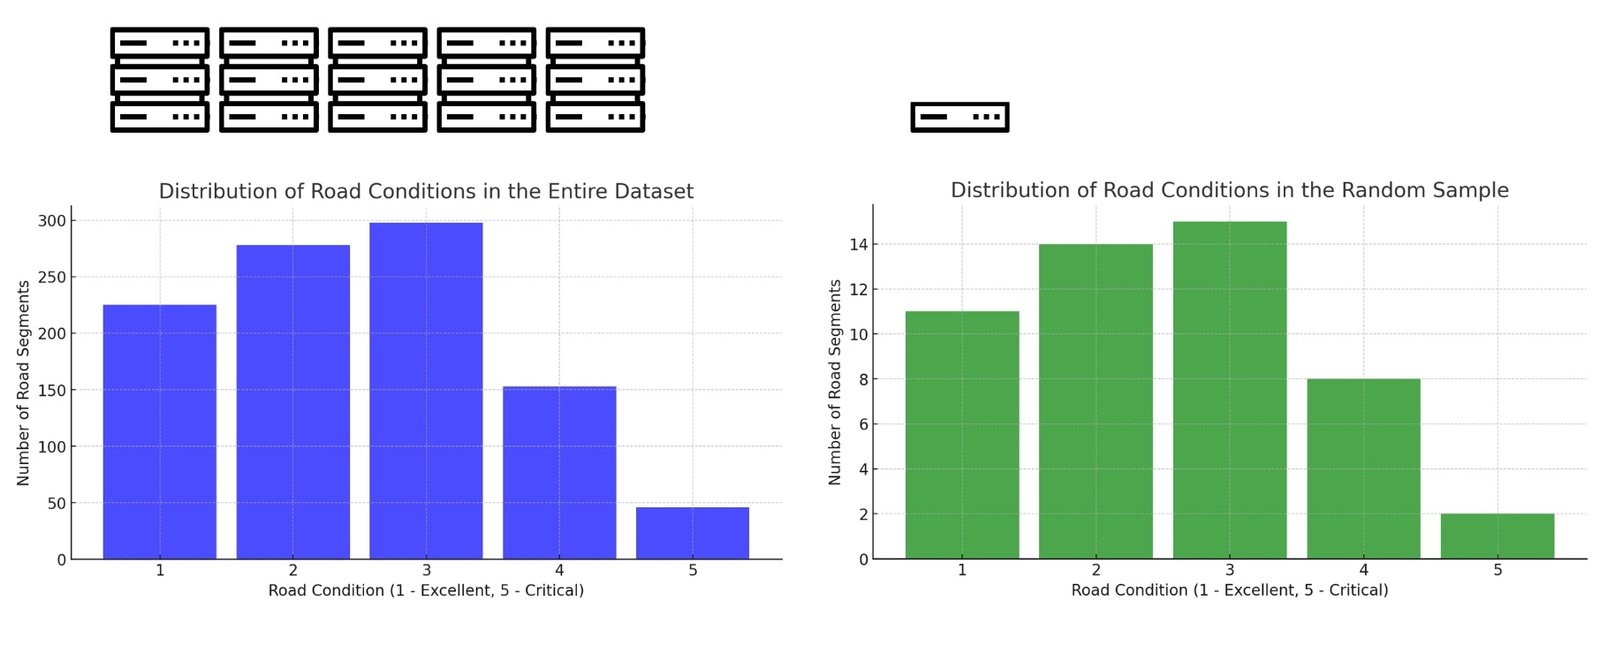
Thus, the key to successful data analysis may often not be the amount of data, but the representativeness of the sample and the quality of the processing methods used. The move to random sampling and a more selective approach requires a shift in thinking in the construction industry. Historically, companies have followed the logic of “the more data the better,” believing that covering all possible indicators would maximize accuracy.
This approach is reminiscent of a popular misconception from project management: “the more specialists I attract, the more effective the work will be”. However, as with staffing, it is quality and tools that are more important than quantity. Without considering the interrelationships (correlations) between data or project participants, increasing volume can only lead to noise, distortion, duplication, and unnecessary waste.
In the end, it often turns out that it is much more productive to have a smaller, but qualitatively prepared data set capable of producing stable and reasonable forecasts than to rely on massive but chaotic information containing many contradictory signals.
Excessive data volume not only does not guarantee greater accuracy, but can also lead to distorted conclusions due to the presence of noise, redundant features, hidden correlations and irrelevant information. In such conditions, the risk of overfitting models increases and the reliability of analytical results decreases.
In construction, a major challenge in dealing with big data is determining the optimal quantity and quality of data. For example, when monitoring the condition of concrete structures, using thousands of sensors and collecting information every minute can overwhelm the storage and analysis system. However, if you perform a correlation analysis and select the 10% most informative sensors, you can get almost identical prediction accuracy, spending many times, sometimes tens or hundreds of times, fewer resources.
Using a smaller subset of data reduces both the amount of storage required and the processing time, which significantly reduces the cost of storing and analyzing data and often makes random sampling an ideal solution for predictive analytics, especially in large infrastructure projects or when working in real-time. Ultimately, the efficiency of construction processes is not determined by the amount of data collected, but by the quality of its analysis. Without a critical approach and careful analysis, data can lead to incorrect conclusions.
After a certain amount of data, each new unit of information yields less and less useful results. Instead of endlessly collecting information, it is important to focus on its representativeness and methods of analysis (Fig. 9.2-2).
This phenomenon is well described by Allen Wallis (T. J. S. a. J. S. Jesse Perla, “A Problem that Stumped Milton Friedman,” Quantitative Economics with Julia, 1 Jan. 2025), who illustrates the use of statistical methods using the example of testing two alternative U.S. Navy projectile designs.
The Navy tested two alternative projectile designs (A and B) by conducting a series of paired rounds. In each round, A receives a 1 or 0 depending on whether its performance is better or worse than that of B, and vice versa. The standard statistical approach involves conducting a fixed number of trials (e.g., 1000) and determining the winner based on a percentage distribution (e.g., if A gets a 1 more than 53% of the time, it is considered the best). When Allen Wallis discussed such a problem with (Navy) Captain Garrett L. Schuyler, the captain objected that such a test, to quote Allen’s story, might be useless. If a wise and experienced ordnance officer such as Schuyler had been on the spot, he would have seen after the first few hundred [shots] that the experiment need not be terminated either because the new method is clearly inferior or because it is clearly superior to what was hoped for (T. J. S. a. J. S. Jesse Perla, “A Problem that Stumped Milton Friedman,” Quantitative Economics with Julia, 1 Jan. 2025).
– U.S. Government Statistical Research Group at Columbia University, World War II period
This principle is widely used in various industries. In medicine, for example, clinical trials of new drugs are conducted on random samples of patients, which makes it possible to obtain statistically significant results without the need to test the drug on the entire population of people living on the planet. In economics and sociology, representative surveys are conducted to reflect the opinion of society without the need to interview every person in the country.
Just as governments and research organizations conduct surveys of small populations to understand general social trends, companies in the construction industry can use random data samples to effectively monitor and create forecasts for project management (Fig. 9.1-1).
Big data may change the approach to social science, but it will not replace statistical common sense(Т. Landsall-Welfair, Predicting the nation’s current mood, Significance, 2012).
– Thomas Landsall-Welfair, “Predicting the nation’s current mood,” Significance v. 9 (4), 2012
From a resource-saving perspective, when collecting data for future predictions and decision-making, it is important to answer the question: does it make sense to spend significant resources to collect and process huge data sets when a much smaller and cheaper test data set that can be scaled up incrementally can be used? The effectiveness of random sampling shows that companies can reduce costs by tens or even thousands of times in collecting and training models by choosing data collection methods that do not require comprehensive coverage, but still provide sufficient accuracy and representativeness. This approach allows even small companies to achieve results on par with large corporations using significantly fewer resources and data volumes, which is important for companies looking to optimize costs and accelerate informed decision making using small resources. In the following chapters, explore examples of analytics and predictive analytics based on public datasets using big data tools.

