
Working with open datasets provides a unique opportunity to put into practice the principles discussed in previous chapters: judicious feature selection, representative sampling, visualization, and critical analysis. In this chapter, we will explore how complex phenomena such as construction activity in a large city can be investigated using open data-specifically, over one million building permit records in San Francisco
Publicly available data on over one million building permits (Fig. 9.1-2) (records in two datasets in CSV format) from the “San Francisco Department of Buildings” (А. Boiko, “San Francisco. Construction Sector 1980-2019,” 2024)allow us to use the raw CSV -table to analyze not only construction activity in the city, but also to critically analyze recent trends and history of San Francisco’s construction industry over the past 40 years, from 1980 to 2019.
The code examples used to create the dataset visualizations (Figures 9.1-3- Figures 9.1-8), as well as visual graphs with code, explanations, and comments, can be found on the Kaggle platform by searching for “San Francisco. Construction Sector 1980-2019.” (А. Boiko, “Kaggle: RVT IFC Files 5000 Projects,” 2024).


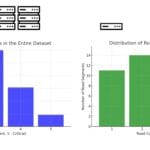
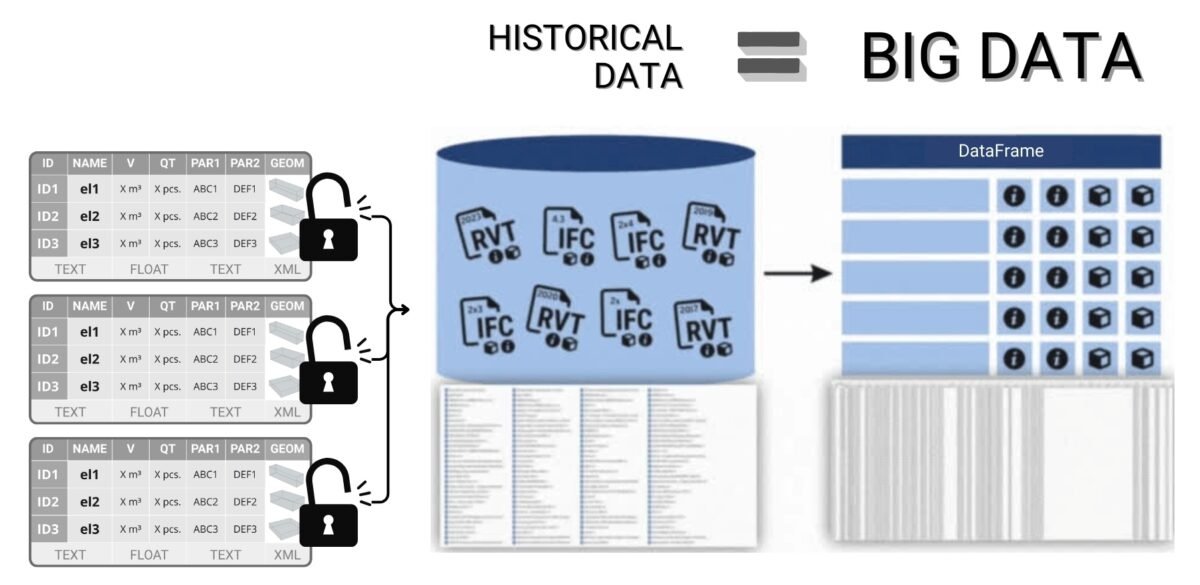
No trends or conclusions are apparent from the table provided by the San Francisco Department of Buildings (Fig. 9.1-2). Dry numbers in tabular form are not a basis for decision making. To make the data visually understandable, as discussed in detail in the chapters on data visualization, it must be visualized using the various libraries discussed in Part Seven of the book on “ETL and visualizing results as graphs”.
By analyzing data, using Pandas DataFrame and Python visualization libraries, on the value of 1,137,695 permits (А. Boiko, “San Francisco. Construction Sector 1980-2019,” 2024), we can conclude that construction activity in San Francisco is closely tied to economic cycles, especially in Silicon Valley’s booming technology industry (Fig. 9.1-4).
Economic booms and busts have a significant impact on the number and value of construction projects. For example, the first peak in construction activity coincided with the electronics boom of the mid-1980s (used Pandas and Matplotlib), and subsequent peaks and declines were associated with the dot-com bubble and the technology boom of recent years.

Data analytics estimates that in San Francisco, most of the $91.5 billion invested in construction and redevelopment over the past decade – nearly 75% – is concentrated in downtown (Fig. 9.1-5 – used Pandas and Folium visualization library) and within a 2 km radius of downtown, reflecting the higher density of investment in these central zones.
The average cost of building permits varies greatly by neighborhood, with applications in the downtown area costing three times as much as those outside the city limits due to higher costs of land, labor, materials, and strict building codes requiring more expensive materials for energy efficiency.

The dataset also allows us to calculate average repair prices not only by house type, but also by city neighborhoods and individual addresses (zip codes). In San Francisco, the dynamics of home renovation costs show distinct trends for different types of renovations and housing (Fig. 9.1-6 – used Pandas and Matplotlib). Kitchen renovations are noticeably more expensive than bathroom renovations: the average kitchen renovation in a single-family home costs about $28,000 compared to $25,000 in a two-family home.

Construction cost inflation in San Francisco over the years can be seen by analyzing data grouped by housing type and year (Fig. 9.1-7 – used Pandas and Seaborn), which shows a steady increase in average repair costs since 1990 and reveals short-term three-year cycles in multifamily repair costs.

A study of public data from the San Francisco Building Department (Exhibit 9.1-3) reveals that construction costs in the City are extremely variable and often unpredictable, being influenced by a variety of factors. These factors include economic growth, technological innovation, and the unique requirements of different housing types.
In the past, this kind of analysis required in-depth knowledge of programming and analytics. However, with the advent of LLM- tools, the process has become accessible and understandable to a wide range of professionals in the construction industry, from engineers in design departments to senior management.

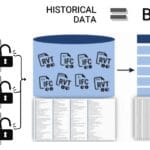
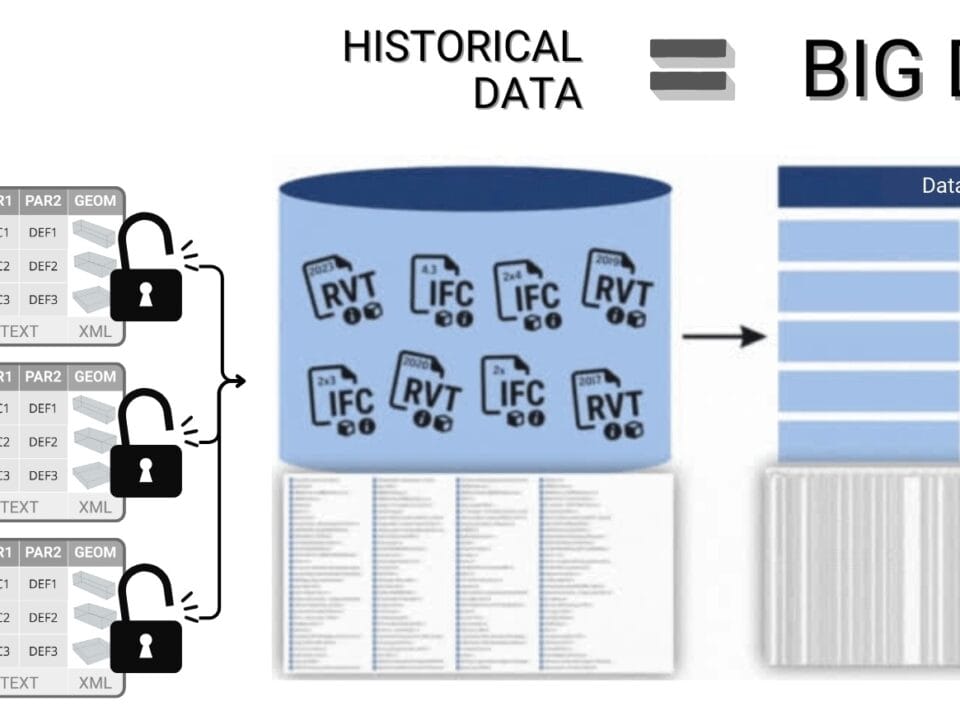
Just as we analyzed data from the “San Francisco Building Authority” tabular dataset, we can visualize and analyze any dataset – from images and documents to IoT data, or data from derived CAD databases.


