

The main hypothesis used to explore the machine learning framework based on the Titanic dataset is that certain groups of passengers had a higher chance of survival.
The small table of Titanic passengers has become popular all over the world, and millions of people use it for training, experimentation and model testing to find out what algorithms and hypotheses will maximize the accurate survival prediction model based on the training dataset for Titanic passengers.
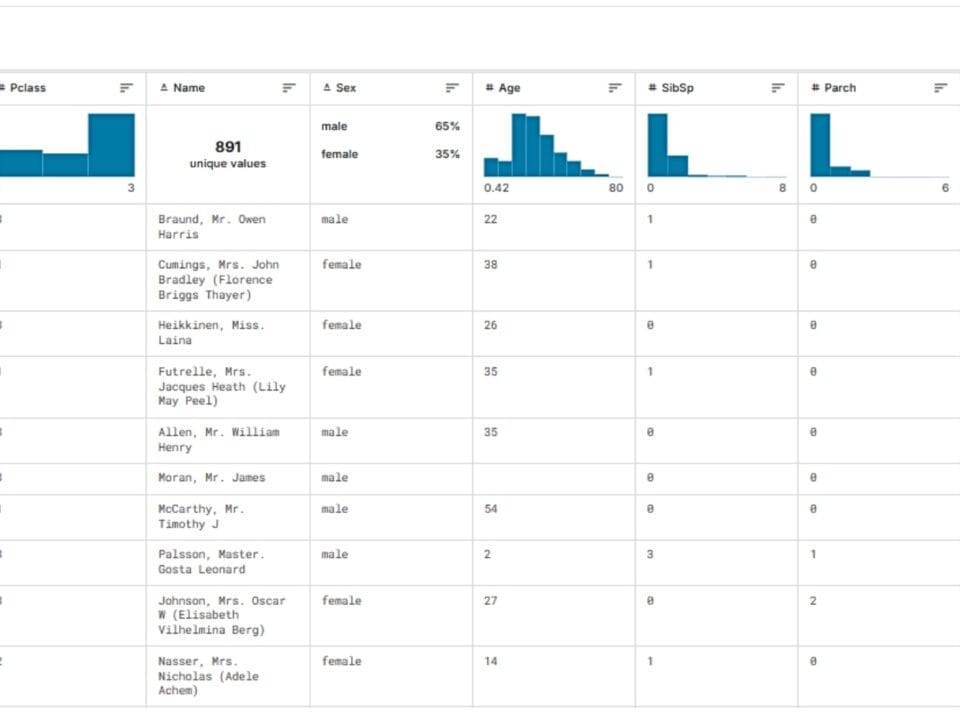
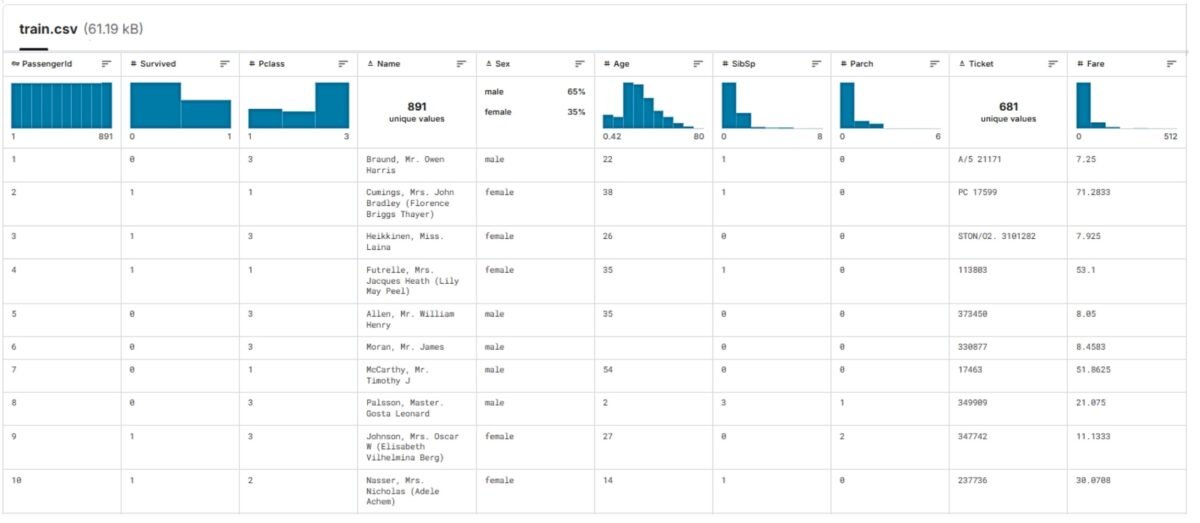
The appeal of the Titanic dataset is due to its compactness: with several hundred rows and twelve columns (Fig. 9.2-6), it provides ample opportunity for analysis. The dataset is, relatively simply, a classic example of a binary classification solution, where the goal of the problem – survival – is expressed in the convenient format 0 or 1.
John Wheeler in “It from Bit” (“Papyrus, 3rd century B.C. Language is Greek,” 2024)argues that the universe is based on binary choices. Similarly, a business run by people made up of molecules is actually built on a series of binary choices.
In addition, the data is based on a real historical event, which makes it valuable for research, unlike artificially created examples. On the Kaggle platform alone, one of the largest Data Pipeline and ETL, 1,355,998 people participated in the Titanic dataset-based challenges, developing 53,963 unique Data Pipeline solutions (Kaggle, “Titanic – Machine Learning from Disaster,” 1 Jan. 2025)(Fig. 9.2-9).
It seems unbelievable, but just 1000 lines of data on the Titanic passengers with 12 parameters have become a field for millions of hypotheses, logical chains and unique Data-Pipelines. From a small dataset are born endless insights, hypotheses and interpretations – from simple survival models to complex ensembles that take into account hidden patterns and complex labyrinths of reasoning.

If even such a small table can generate millions of unique solutions (Fig. 9.2-9), what can we say about real industrial construction datasets where parameters are measured in tens of thousands?
A standard CAD -design of a relatively small building contains tens of thousands of entities with thousands of parameters – from geometric characteristics to cost and time attributes. Imagine how many potential insights, relationships, predictions and management hypotheses are hidden in the data from all of your company’s projects collected over the years. Historical project data is not just an archive – it is the living memory of an organization, its digital footprint that can be analyzed to build a large number of unique hypotheses.
Most importantly, you don’t have to wait for the Kaggle community to take an interest in your company or your data. You can start working with what you have today: run analytics on your own data, train models on your own data, identify repeats, anomalies, and patterns. Where it used to take years of experimentation and expensive consulting, today all you need is initiative, an LLM, an open approach to data, and a willingness to learn.
- To build a machine learning algorithm, which will predict passenger survival rates based on the train.csv passenger training dataset let’s ask LLM to solve this problem for us:
Based on the Titanic passenger training dataset, build a machine learning model to predict survivability ⏎
 |
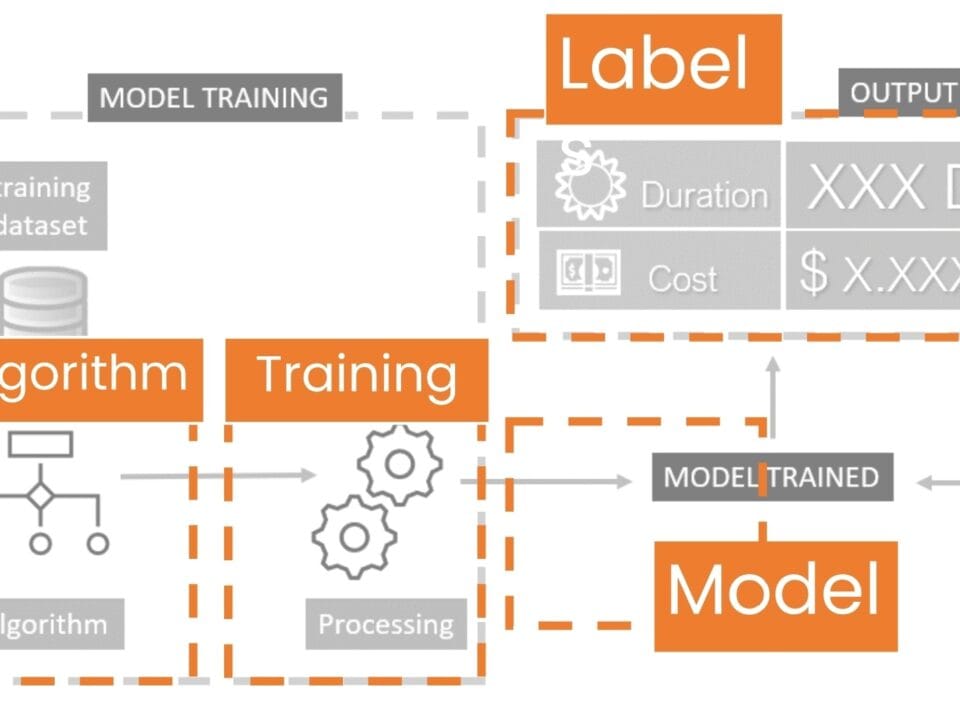
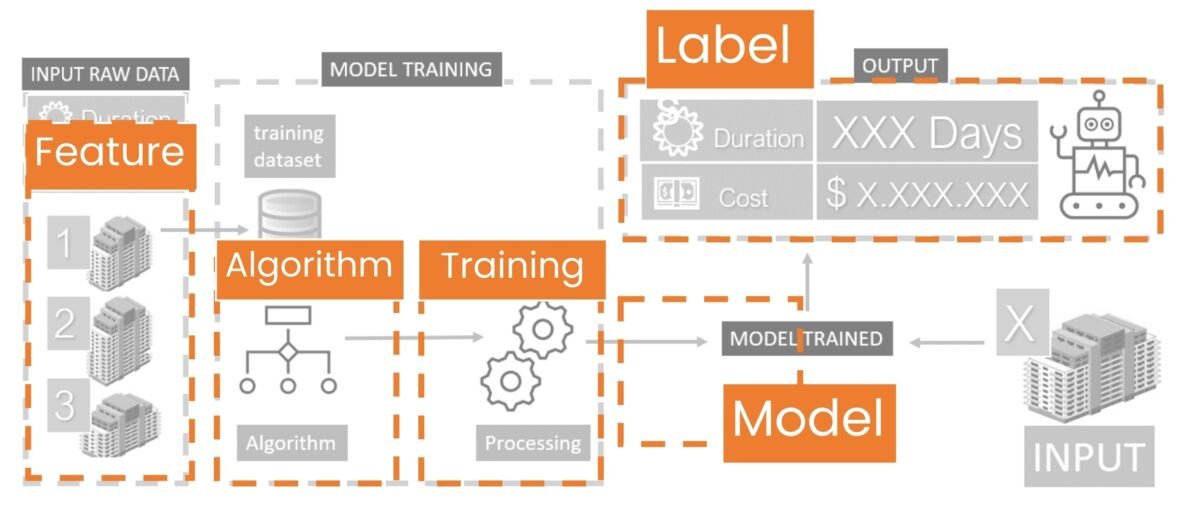
The resulting code from LLM (Fig. 9.2-10) loads Titanic passenger data, cleans it, converts categorical variables (e.g., gender to numeric format), and trains the model through the RandomForestClassifier algorithm to predict whether a passenger survived or not (we will talk more about popular algorithms in the following chapters).
The code separates the training data into training and test sets (Kaggle’s website has already created ready-made test.csv (Fig. 9.2-7) and train.csv (Fig. 9.2-6) for training, then the model is trained on the training data and tested on the test data to see how good a particular prediction model is. After training, the test data from test.csv (with real data about those who survived or did not survive) is fed into the model and it predicts who survived and who did not. In our case, the accuracy of our machine learning model is about 80%, which shows that it captures the patterns quite well.
Machine learning can be compared to a child trying to fit a rectangular block into a round hole. In the initial stages, the algorithm tries many approaches, encountering errors and inconsistencies. This process may seem inefficient, but it provides important learning: by analyzing each error, the model improves its predictions and makes increasingly accurate decisions.
Now this model (Fig. 9.2-10) can be used to predict the survival rate of new passengers and for example, if you feed it with passenger information using the model.predict function the parameters: “male”, “3rd class”, “25 years old”, “no relatives on board”, the model will produce a prediction – that the passenger with 80% probability will not survive the catastrophe if he was on the Titanic ship in 1912 (Fig. 9.2-11).

The Titanic passenger survival prediction model illustrates a much broader concept: every day, thousands of professionals in the construction industry make similar “dual” decisions – the life or death of a decision, a project, an estimate, a tool, profit or loss, safety or risk. As in the Titanic example, where the outcome depended on factors (gender, age, class), in construction each aspect of the decision is influenced by many of its own factors and variables (columns of tables): cost of materials, skill of workers, timing, weather, logistics, technical risks, comments and hundreds of thousands of other parameters.
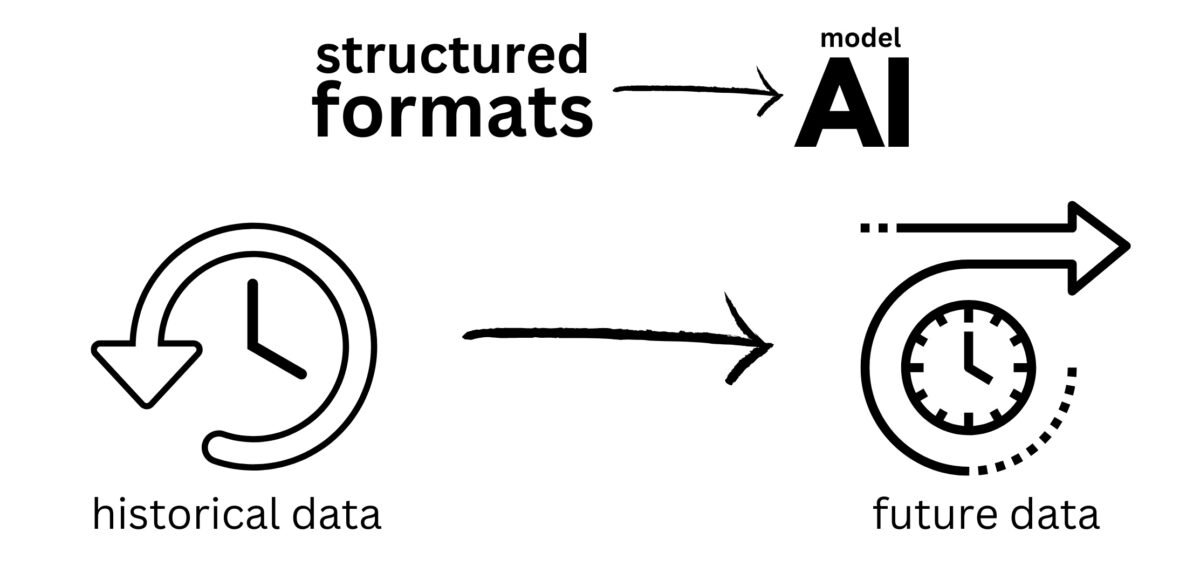
In the construction industry, machine learning follows the same principles as in other fields: models are trained on historical data – from projects, contracts, estimates – to test various hypotheses and find the most effective solutions. This process is much like teaching a child through trial and error: with each cycle, the models adapt and become more accurate.
The use of accumulated data opens up new horizons for construction. Instead of time-consuming manual calculations, models can be trained that can predict key characteristics of future projects with a high degree of accuracy. In this way, predictive analytics transforms the construction industry into a space where you can not only plan, but also confidently predict developments.


