
In the process of performing various computations in construction projects, it is often necessary to group the entity elements by more than one attribute.
For example, we can classify entities in the category "Windows" (entities with the value "OST_Windows" or "IFC_Windows" in the "Category" attribute) into different types of windows, selecting only those that have the text value "Type 1" in the type name attribute (e.g. "Type Name" or "Type"), or sort the same items by the thermal conductivity specified in one of the attributes. Similarly, you can group entities of different wall and floor types, where the grouping criteria can include any number of attributes and their values.

For each group or category of creatures, there is a different grouping formula for finding qualitative quantitative attributes
The process of defining such grouping rules is similar to the process of creating data requirements described in the chapter "Creating Requirements and Data Quality Checks". Such grouping and calculation rules ensure that the results are accurate and relevant for calculating the total attributes of the quantity or volume of any entity category, taking into account all necessary conditions.
The following code sample filters the project table so that the resulting dataset contains only those entities in which the Category attribute-column contains the values "OST_Windows" or "IfcWindows" and at the same time the Type attribute-column contains the value "Type 1".
❏ Text request to ChatGPT:
I have a Project Dataframe - filter the data so that only records with "Category" containing the values "OST_Windows" or "IfcWindows" and simultaneously the Type attribute containing the value "Type 1" remain in the dataset.
➤ ChatGPT Answer:
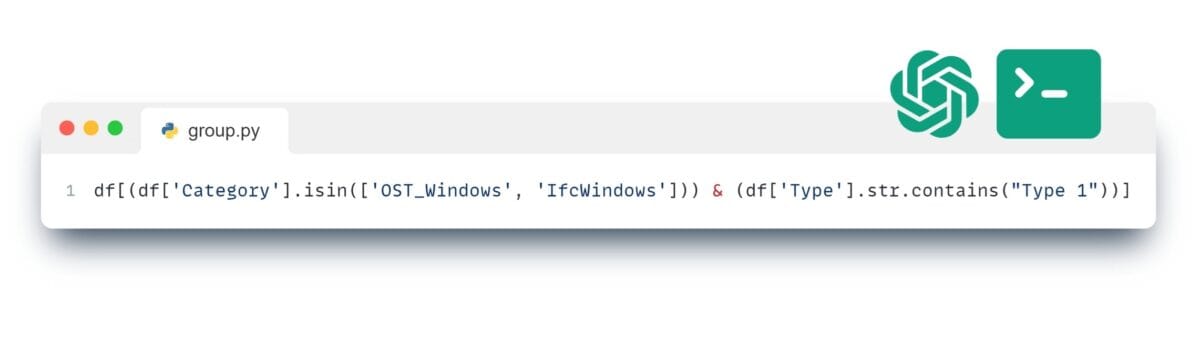
A single line of code, similar to an Excel formula written with ChatGPT, allows you to group all of the project's creatures by several attributes
To get the project entities in the DataFrame form by window category only with a specific thermal conductivity value, you can use the following code in Pandas:
❏ Text request to ChatGPT:
I have a Project Dataframe - filter the data so that only records with "Category" containing "OST_Windows" or "IfcWindows" values remain in the dataset and simultaneously the ThermalConductivity column should have a value of 0.5. ⏎
➤ ChatGPT Answer:
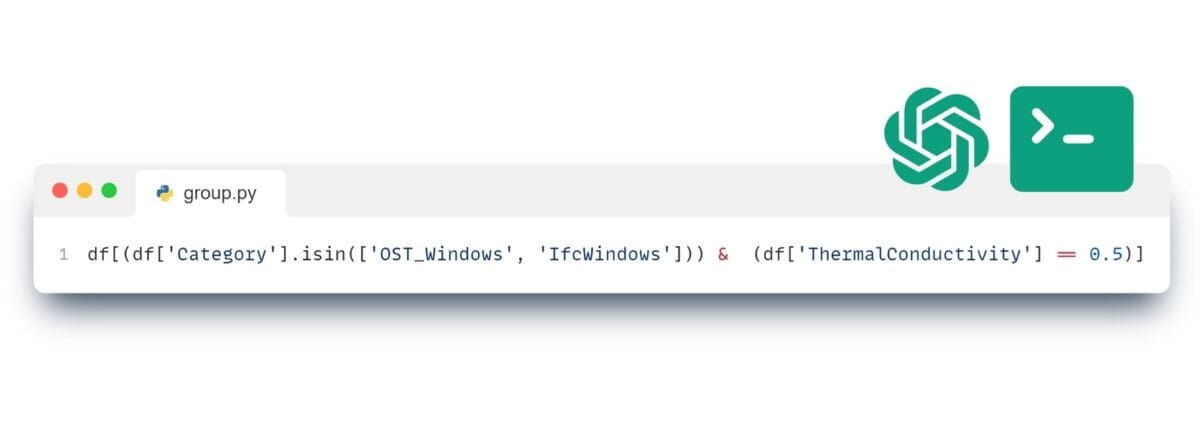
Compared to other programming languages, working with Pandas and Python provides convenient and readable data processing functionality
In this example, as in the first example, we use the logical condition “&” to combine two criteria (which could be dozens and hundreds): thermal conductivity value and belonging to one of the two window categories. The “isin” method checks if the value of the “Category” attribute-column is contained in the provided list.
Next, we will look at each category of project creature, establishing a separate grouping rule for each and determining the final formula for calculating the cost of the volume attribute. This formula will take into account the unique characteristics of the group and include adjustments such as an additional 10% of material volume or a specific additional quantity of material. And let's save the grouping rules with formulas for each category as a structured table.
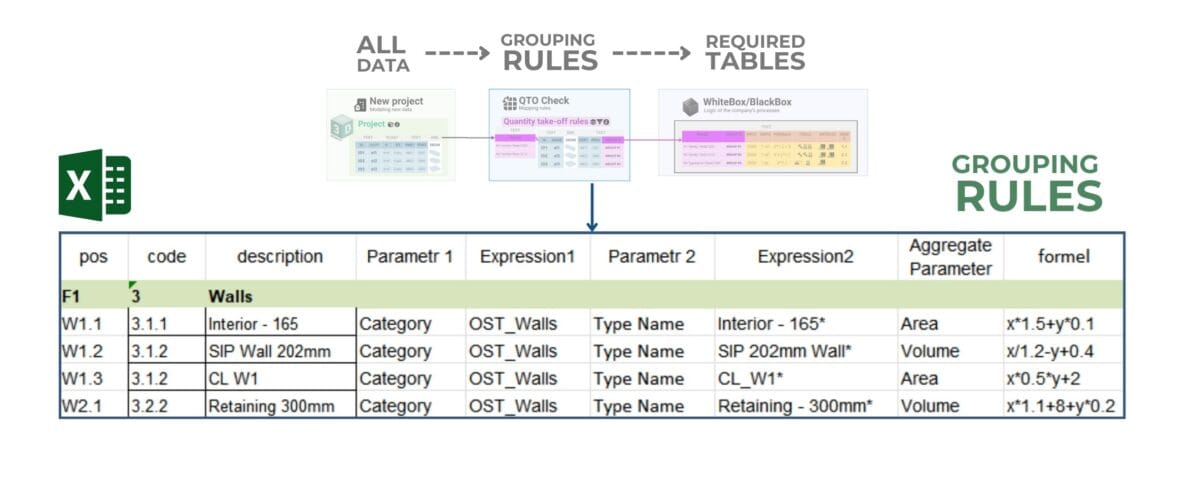
The QTO attribute grouping table establishes the rules for grouping of project elements, which allows the correct total attributes of quantity and volume for each category
Having collected the attribute grouping rules for each category in an Excel file, we can now automatically run the project table through the grouping rules table and group the entire project to perform all necessary calculations given the volume attributes.
In the process of automatic creation of volumetric tables, our application should go through all categories of the grouping rules table, take the grouping attributes, group all elements of the project according to them and aggregate the volume attribute for this group additionally multiplying it by a factor or coefficient.
Let's ask ChatGPT to write code for us for such a solution, where the code would have to load two tables - a table of grouping rules and a table of the project itself, and then apply the grouping rules, group the items according to the given rules, calculate the aggregated values and save the results to an Excel file.
❏ Text request to ChatGPT:
Need code to read data from 'basic_sample_project.xlsx', clear columns 'Area', 'Volume' etc. from non-numeric characters and then from the file Grouping_rules_QTO.xlsx group all data by 'Parameter 1' and 'Parameter 2', aggregate 'Aggregate Parameter', filter by 'Expression2', perform calculations from 'Formel1' and save the final table to 'QTQ_table2.xlsx'. ⏎
➤ ChatGPT Answer:
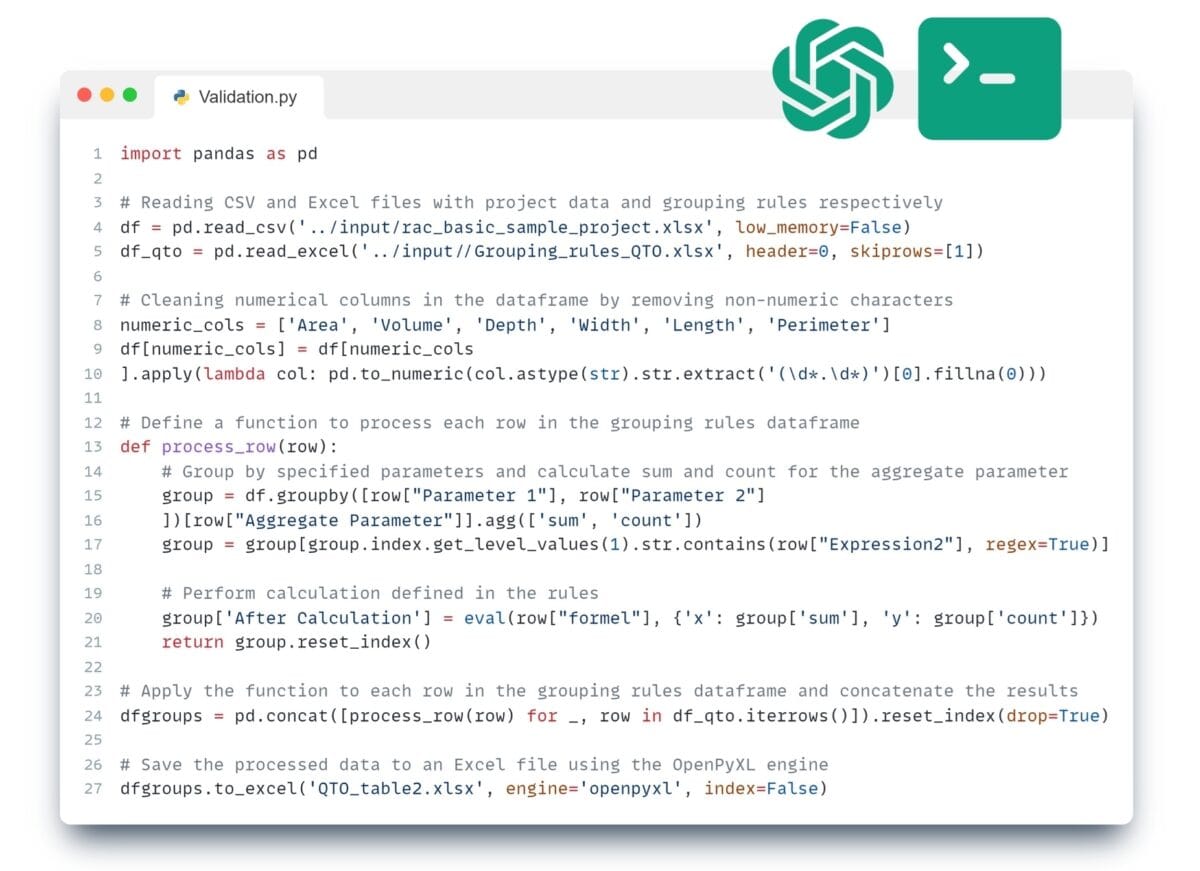
A Python script using the pandas library processes CAD (BIM) design data, grouping it according to specified rules
The final result of the code execution will be a table of groups-entities, which contains not just summarized volume attributes from the source CAD (BIM) model - but a new real volume attribute "After Calculation" taking into account the requirements of estimators.
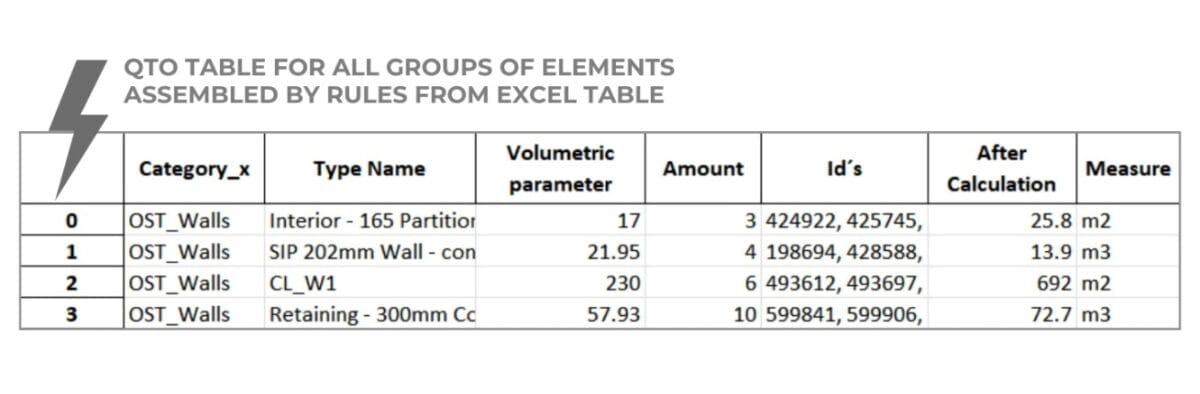
The final table contains a new column attribute of the entity group "After Calculation", which calculates the actual volumes for the element groups
We can now apply such code to any number of existing or incoming projects (RVT, IFC, DWG, DGN and others), whether it is a few projects or tens, hundreds of thousands of projects in different formats.
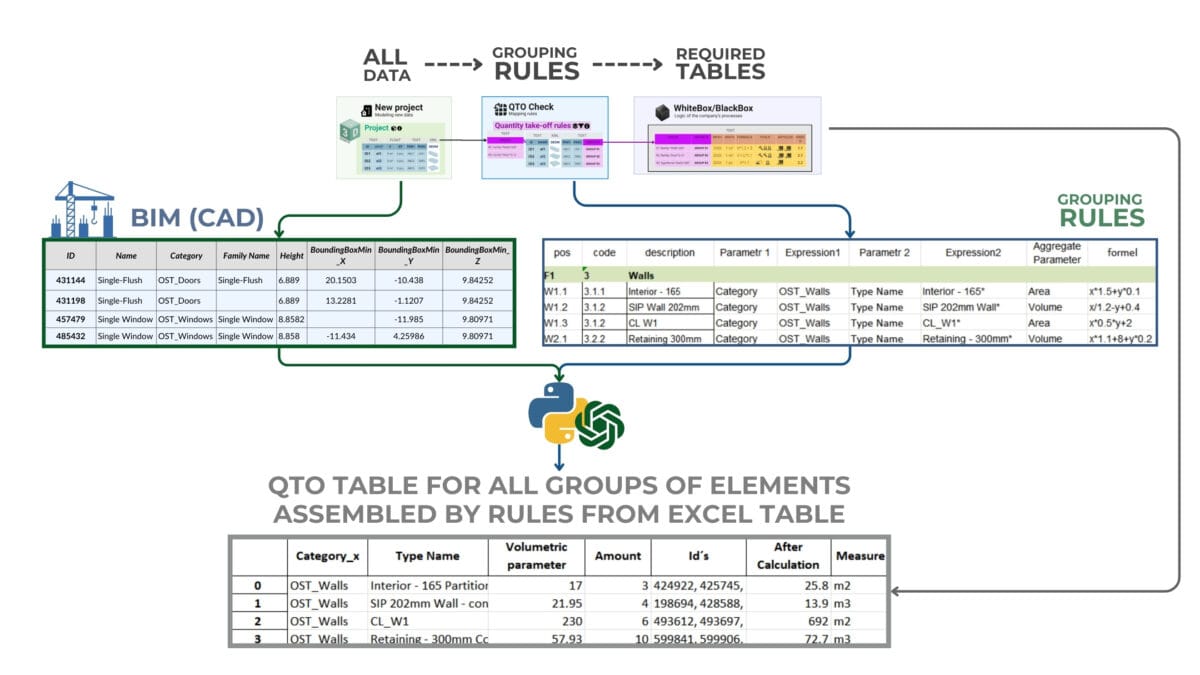
Schematic representation of the data grouping process in construction, linking BIM (CAD) data with quantitative volume estimation (QTO) tables generated by rules from an Excel spreadsheet
Such a process allows fully automated collection of data on quantitative attributes and volumes of project elements for further work with them, including cost estimating, carbon footprint calculation or other analytical tasks in construction.
Having learned the different types of data and the tools that make it easy to organize and group them by specific attributes, we are now ready to integrate project data with various company business scenarios. In scenarios such as quantity calculation (QTO), this usually means performing tasks such as multiplying, validating or grouping attribute-columns of tabular data or applying attribute-column multiplication of attribute-column information from structured rule tables to attribute-columns of a structured project table.