
Data-driven decision-making
23 February 2024
KPIs scores and dashboards
23 February 2024

Data visualization

In today's construction industry, where project data is characterized by complexity and multi-level structure, visualization plays a key role. Data visualization allows project managers and engineers to visualize complex patterns and trends hidden in large, heterogeneous volumes of data.

Data visualization makes it easier to understand the state of a project: resource allocation, cost trends or material usage. Through graphs and charts, complex and dry information becomes accessible and understandable, allowing to quickly identify key areas for attention and spot potential problems.
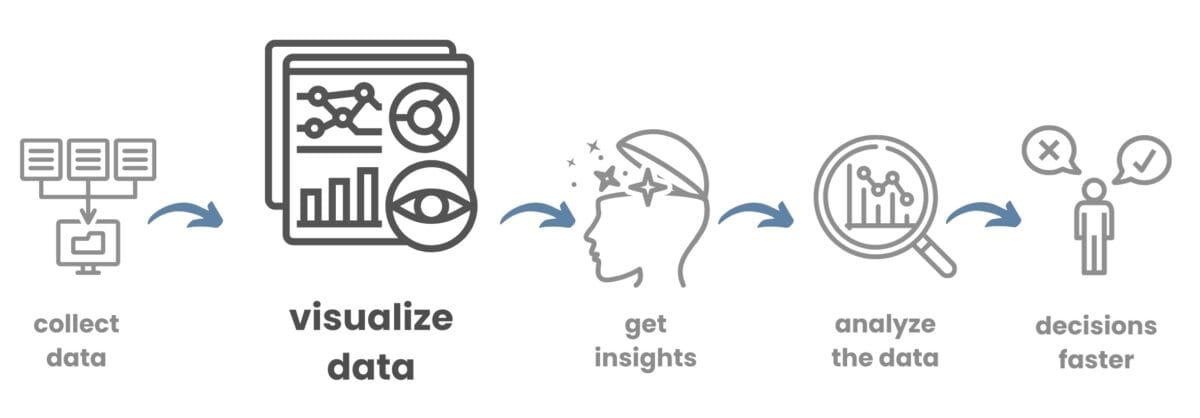
Data visualization doesn't just make information easier to interpret, it is a critical first step in the analytical process and in making informed management decisions. Before making key decisions, project managers are more likely to use visual representations of data rather than dry and difficult to interpret figures from spreadsheets or text messages.

Data that is not supported by visualization is like building materials strewn haphazardly on a site: its potential is not clear. Only when a clear visualization emerges from them - like a house made of bricks and concrete - does it become clear what value they hold. Until the house is built, it is hard to say whether the pile of materials will become a cozy hut, a luxury villa or skyscraper.

In the context of business processes, companies have data from various systems (ERP, CRM, etc.), financial transactions, and vast amounts of textual data, including contracts, agreements, feedback, comments, and company logs. However, it is not always clear how this data can be maximized for the overall benefit of the business.

In such situations, visualization becomes an important tool for conveying meaning in data, which helps to present information in formats understandable to any expert, such as dashboards, graphs, and charts.

The process of digesting and turning information into visual graphic forms such as charts, graphs improve the human brain's understanding and interpretation of data and enables project managers and analysts to quickly assess complex scenarios and make informed decisions based on facts rather than intuition (the creation of visualisations will be discussed in more detail in the chapter "ETL and Process Automation").
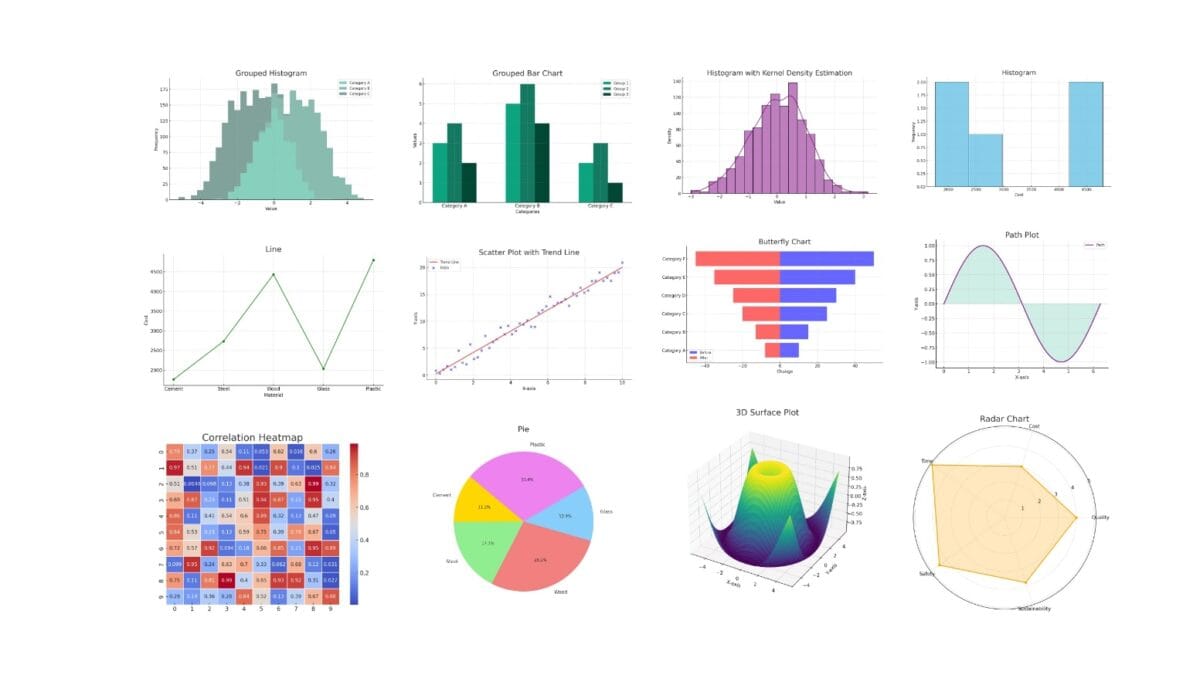
Data visualization can reveal business trends, which, through analysis and analytics, can help create KPIs (key performance indicators) for individual specialists and departments, as well as make predictions for the next quarter or fiscal year using historical company data.

Leave a Reply

Change language

Post's Highlights

Stay updated: news and insights


We’re Here to Help

Fresh solutions are released through our social channels

UNLOCK THE POWER OF DATA
 IN CONSTRUCTION

Dive into the world of data-driven construction with this accessible guide, perfect for professionals and novices alike.
From the basics of data management to cutting-edge trends in digital transformation, this book
will be your comprehensive guide to using data in the construction industry.

Related posts 

Focus Areas

Search

Search
Sorry, no articles found.

✕

Don't miss the new solutions


✕
✕

Linux

macOS

Looking for the Linux or MAC version? Send us a quick message using the button below, and we’ll guide you through the process!

✕

📥 Download OnePager

Welcome to DataDrivenConstruction—where data meets innovation in the construction industry. Our One-Pager offers a concise overview of how our data-driven solutions can transform your projects, enhance efficiency, and drive sustainable growth. 

✕

🚀 Welcome to the future of data in construction!

You're taking your first step into the world of open data, working with normalized, structured data—the foundation of data analytics and modern automation tools.

By downloading, you agree to the DataDrivenConstruction terms of use 

Stay ahead with the latest updates on converters, tools, AI, LLM
and data analytics in construction — Subscribe now!

✕

🚀 Welcome to the future of data in construction!

You're taking your first step into the world of open data, working with normalized, structured data—the foundation of data analytics and modern automation tools.

By downloading, you agree to the DataDrivenConstruction terms of use 

Stay ahead with the latest updates on converters, tools, AI, LLM
and data analytics in construction — Subscribe now!

✕

🚀 Welcome to the future of data in construction!

You're taking your first step into the world of open data, working with normalized, structured data—the foundation of data analytics and modern automation tools.

By downloading, you agree to the DataDrivenConstruction terms of use 

Stay ahead with the latest updates on converters, tools, AI, LLM
and data analytics in construction — Subscribe now!

✕

🚀 Welcome to the future of data in construction!

You're taking your first step into the world of open data, working with normalized, structured data—the foundation of data analytics and modern automation tools.

By downloading, you agree to the DataDrivenConstruction terms of use 

Stay ahead with the latest updates on converters, tools, AI, LLM
and data analytics in construction — Subscribe now!

✕

🚀 Welcome to the future of data in construction!

You're taking your first step into the world of open data, working with normalized, structured data—the foundation of data analytics and modern automation tools.

By downloading, you agree to the DDC terms of use 

✕

🚀 Welcome to the future of data in construction!

You're taking your first step into the world of open data, working with normalized, structured data—the foundation of data analytics and modern automation tools.

By downloading, you agree to the DataDrivenConstruction terms of use 

Stay ahead with the latest updates on converters, tools, AI, LLM
and data analytics in construction — Subscribe now!

✕
DataDrivenConstruction offers workshops tested and practiced on global leaders in the construction industry to help your team navigate and leverage the power of data and artificial intelligence in your company's decision making.

Reserve your spot now to rethink your
approach to decision making!

✕


🚀 Welcome to the future of data in construction!

By downloading, you agree to the DataDrivenConstruction terms of use 

Stay ahead with the latest updates on converters, tools, AI, LLM
and data analytics in construction — Subscribe now!

✕
Have a question or need more information? Reach out to us directly!
Schedule a time to discuss your needs with our team.
Tailored sessions to help your team grow — let's plan together!
✕
Have you attended one of our workshops, read our book, or used our solutions? Share your thoughts with us!
Name
✕
Data Maturity Diagnostics

🧰 Data-Driven Readiness Check

This short assessment will help you identify your company's data management pain points and offer solutions to improve project efficiency. It takes only 1–2 minutes to complete and you will receive personalized recommendations tailored to your needs.

✕

Clean & Organized Data

Theoretical Chapters:

Practical Chapters:

What You'll Find on
DDC Solutions:

  • CAD/BIM to spreadsheet/database converters (Revit, AutoCAD, IFC, Microstation)
  • Ready-to-deploy n8n workflows for construction processes
  • ETL pipelines for data synchronization between systems
  • Customizable Python scripts for repetitive tasks
  • Intelligent data validation and error detection
  • Real-time dashboard connectors
  • Automated reporting systems
✕

Connect Everything

Theoretical Chapters:

Practical Chapters:

What You'll Find on
DDC Solutions:

  • CAD/BIM to spreadsheet/database converters (Revit, AutoCAD, IFC, Microstation)
  • Ready-to-deploy n8n workflows for construction processes
  • ETL pipelines for data synchronization between systems
  • Customizable Python scripts for repetitive tasks
  • Intelligent data validation and error detection
  • Real-time dashboard connectors
  • Automated reporting systems
✕

Add AI & LLM Brain

Theoretical Chapters:

Practical Chapters:

What You'll Find on
DDC Solutions:

  • CAD/BIM to spreadsheet/database converters (Revit, AutoCAD, IFC, Microstation)
  • Ready-to-deploy n8n workflows for construction processes
  • ETL pipelines for data synchronization between systems
  • Customizable Python scripts for repetitive tasks
  • Intelligent data validation and error detection
  • Real-time dashboard connectors
  • Automated reporting systems
Data visualization
This website uses cookies to improve your experience. By using this website you agree to our Data Protection Policy.
Read more
×