Data visualization
23 February 2024
Analytics and data analysis
23 February 2024

KPIs scores and dashboards

In today's construction industry, managing key performance indicators (KPIs) and visualizing them through reports and dashboards (dashboards) play a crucial role in improving productivity and project management efficiency.

KPIs in construction serve to evaluate various aspects of a project, from lead times to budget costs.

To calculate a KPI, a formula is usually used that includes actual and planned indicators. For example, to calculate an individual KPI for an employee or an entire department, the actual performance should be divided by the planned performance and the result multiplied by 100%.

Regular measurement of KPIs indicators, based on data collected from various sources such as material consumption, labor hours and costs, allows project management to effectively manage resources and make quick decisions. Storing this data in the long term allows for analyzing future trends and optimizing processes.

A variety of charts and graphs are used to visualize key performance indicators (KPIs), which are usually combined into dashboards for better visualization.

Dashboards are tools that visualize KPIs and quantitative estimates, making them easily accessible and understandable for all project participants.

Dashboards provide a centralized view of a project or part of a project, showing relevant metrics in real time, allowing the team to react quickly to any changes and dynamically adapt to new circumstances.
Here are some examples of popular tools in which dashboards can be created:

  • Power BI is a tool from Microsoft for creating interactive reports and dashboards.
  • Tableau and Google Data Studio are powerful tools for visualizing data and creating dashboards without having to write code.
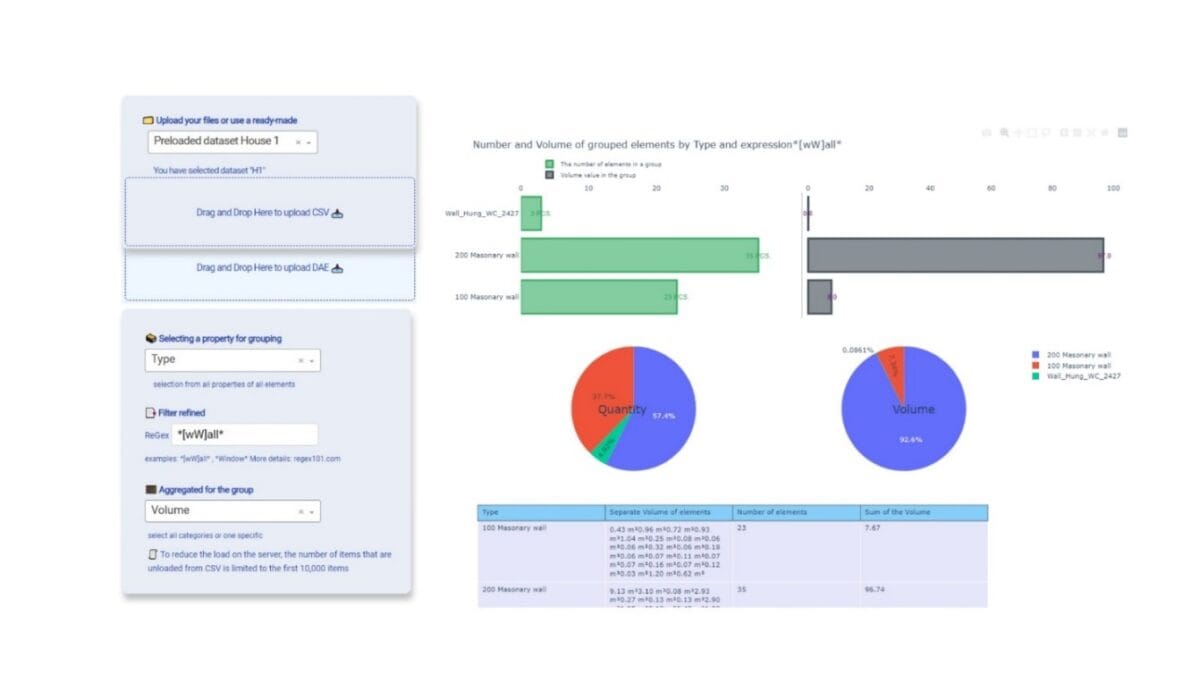
  • Plotly (Figure 4.1-6, Figure 4.2-12) is a library for creating interactive graphs, and Dash is a framework for creating web applications for analyzing data. It is possible to use them in combination to create interactive dashboards.
  • Python libraries (Figure 4.2-9 - 4.2-11) - Python has many libraries for data visualization such as Matplotlib, Seaborn, Plotly, Bokeh and others. They can be used to create graphs and integrate them into a web application using frameworks such as Flask or Django.
  • JavaScript Libraries: Allow to create interactive dashboards using JavaScript libraries such as D3.js or Chart.js and integrate them into a web application.

In construction, data is frequently updated from a variety of sources, and capturing when it is entered and updated allows for accurate tracking, relevance and project dynamics. This is particularly important for dashboards as they need to display the most up-to-date information to ensure effective project management.

To evaluate KPIs and create dashboards, up-to-date data and a clear timeline for data collection and analysis are needed.

To process project streaming data, it is necessary to define the time of data collection for a specific process or for all business processes of the company as a whole. This can be, for example, the time of the end of the working day at 19:00 (Figure 4.1-7), at which time the first process-script will be launched, which will collect data from different systems and storages. Then in the next step, this data is automatically processed and converted into a structured format. In the next step, based on the processed information, reports and dashboards are automatically created or all those processes that we have already discussed in detail in the previous chapters of the book are executed. As a result, by 05:00 in the morning, managers already have up-to-date project status reports in the required format.

Effective use of data, KPI relevance and visualization through dashboards are some of the key elements of success in data-driven decision-making processes.

In general, KPIs and dashboards in the construction industry form the basis for an analytical approach to project management. They not only help in tracking and evaluating the current status of projects, but also provide valuable insights for future planning and process optimization.

Leave a Reply

Change language

Post's Highlights

Stay updated: news and insights


We’re Here to Help

Fresh solutions are released through our social channels

UNLOCK THE POWER OF DATA
 IN CONSTRUCTION

Dive into the world of data-driven construction with this accessible guide, perfect for professionals and novices alike.
From the basics of data management to cutting-edge trends in digital transformation, this book
will be your comprehensive guide to using data in the construction industry.

Related posts 

Focus Areas

Search

Search
Sorry, no articles found.

✕

Don't miss the new solutions


✕
✕

Linux

macOS

Looking for the Linux or MAC version? Send us a quick message using the button below, and we’ll guide you through the process!

✕

📥 Download OnePager

Welcome to DataDrivenConstruction—where data meets innovation in the construction industry. Our One-Pager offers a concise overview of how our data-driven solutions can transform your projects, enhance efficiency, and drive sustainable growth. 

✕

🚀 Welcome to the future of data in construction!

You're taking your first step into the world of open data, working with normalized, structured data—the foundation of data analytics and modern automation tools.

By downloading, you agree to the DataDrivenConstruction terms of use 

Stay ahead with the latest updates on converters, tools, AI, LLM
and data analytics in construction — Subscribe now!

✕

🚀 Welcome to the future of data in construction!

You're taking your first step into the world of open data, working with normalized, structured data—the foundation of data analytics and modern automation tools.

By downloading, you agree to the DataDrivenConstruction terms of use 

Stay ahead with the latest updates on converters, tools, AI, LLM
and data analytics in construction — Subscribe now!

✕

🚀 Welcome to the future of data in construction!

You're taking your first step into the world of open data, working with normalized, structured data—the foundation of data analytics and modern automation tools.

By downloading, you agree to the DataDrivenConstruction terms of use 

Stay ahead with the latest updates on converters, tools, AI, LLM
and data analytics in construction — Subscribe now!

✕

🚀 Welcome to the future of data in construction!

You're taking your first step into the world of open data, working with normalized, structured data—the foundation of data analytics and modern automation tools.

By downloading, you agree to the DataDrivenConstruction terms of use 

Stay ahead with the latest updates on converters, tools, AI, LLM
and data analytics in construction — Subscribe now!

✕

🚀 Welcome to the future of data in construction!

You're taking your first step into the world of open data, working with normalized, structured data—the foundation of data analytics and modern automation tools.

By downloading, you agree to the DDC terms of use 

✕

🚀 Welcome to the future of data in construction!

You're taking your first step into the world of open data, working with normalized, structured data—the foundation of data analytics and modern automation tools.

By downloading, you agree to the DataDrivenConstruction terms of use 

Stay ahead with the latest updates on converters, tools, AI, LLM
and data analytics in construction — Subscribe now!

✕
DataDrivenConstruction offers workshops tested and practiced on global leaders in the construction industry to help your team navigate and leverage the power of data and artificial intelligence in your company's decision making.

Reserve your spot now to rethink your
approach to decision making!

✕


🚀 Welcome to the future of data in construction!

By downloading, you agree to the DataDrivenConstruction terms of use 

Stay ahead with the latest updates on converters, tools, AI, LLM
and data analytics in construction — Subscribe now!

✕
Have a question or need more information? Reach out to us directly!
Schedule a time to discuss your needs with our team.
Tailored sessions to help your team grow — let's plan together!
✕
Have you attended one of our workshops, read our book, or used our solutions? Share your thoughts with us!
Name
✕
Data Maturity Diagnostics

🧰 Data-Driven Readiness Check

This short assessment will help you identify your company's data management pain points and offer solutions to improve project efficiency. It takes only 1–2 minutes to complete and you will receive personalized recommendations tailored to your needs.

✕

Clean & Organized Data

Theoretical Chapters:

Practical Chapters:

What You'll Find on
DDC Solutions:

  • CAD/BIM to spreadsheet/database converters (Revit, AutoCAD, IFC, Microstation)
  • Ready-to-deploy n8n workflows for construction processes
  • ETL pipelines for data synchronization between systems
  • Customizable Python scripts for repetitive tasks
  • Intelligent data validation and error detection
  • Real-time dashboard connectors
  • Automated reporting systems
✕

Connect Everything

Theoretical Chapters:

Practical Chapters:

What You'll Find on
DDC Solutions:

  • CAD/BIM to spreadsheet/database converters (Revit, AutoCAD, IFC, Microstation)
  • Ready-to-deploy n8n workflows for construction processes
  • ETL pipelines for data synchronization between systems
  • Customizable Python scripts for repetitive tasks
  • Intelligent data validation and error detection
  • Real-time dashboard connectors
  • Automated reporting systems
✕

Add AI & LLM Brain

Theoretical Chapters:

Practical Chapters:

What You'll Find on
DDC Solutions:

  • CAD/BIM to spreadsheet/database converters (Revit, AutoCAD, IFC, Microstation)
  • Ready-to-deploy n8n workflows for construction processes
  • ETL pipelines for data synchronization between systems
  • Customizable Python scripts for repetitive tasks
  • Intelligent data validation and error detection
  • Real-time dashboard connectors
  • Automated reporting systems
KPIs scores and dashboards
This website uses cookies to improve your experience. By using this website you agree to our Data Protection Policy.
Read more
×