Structured Data as DataFrame
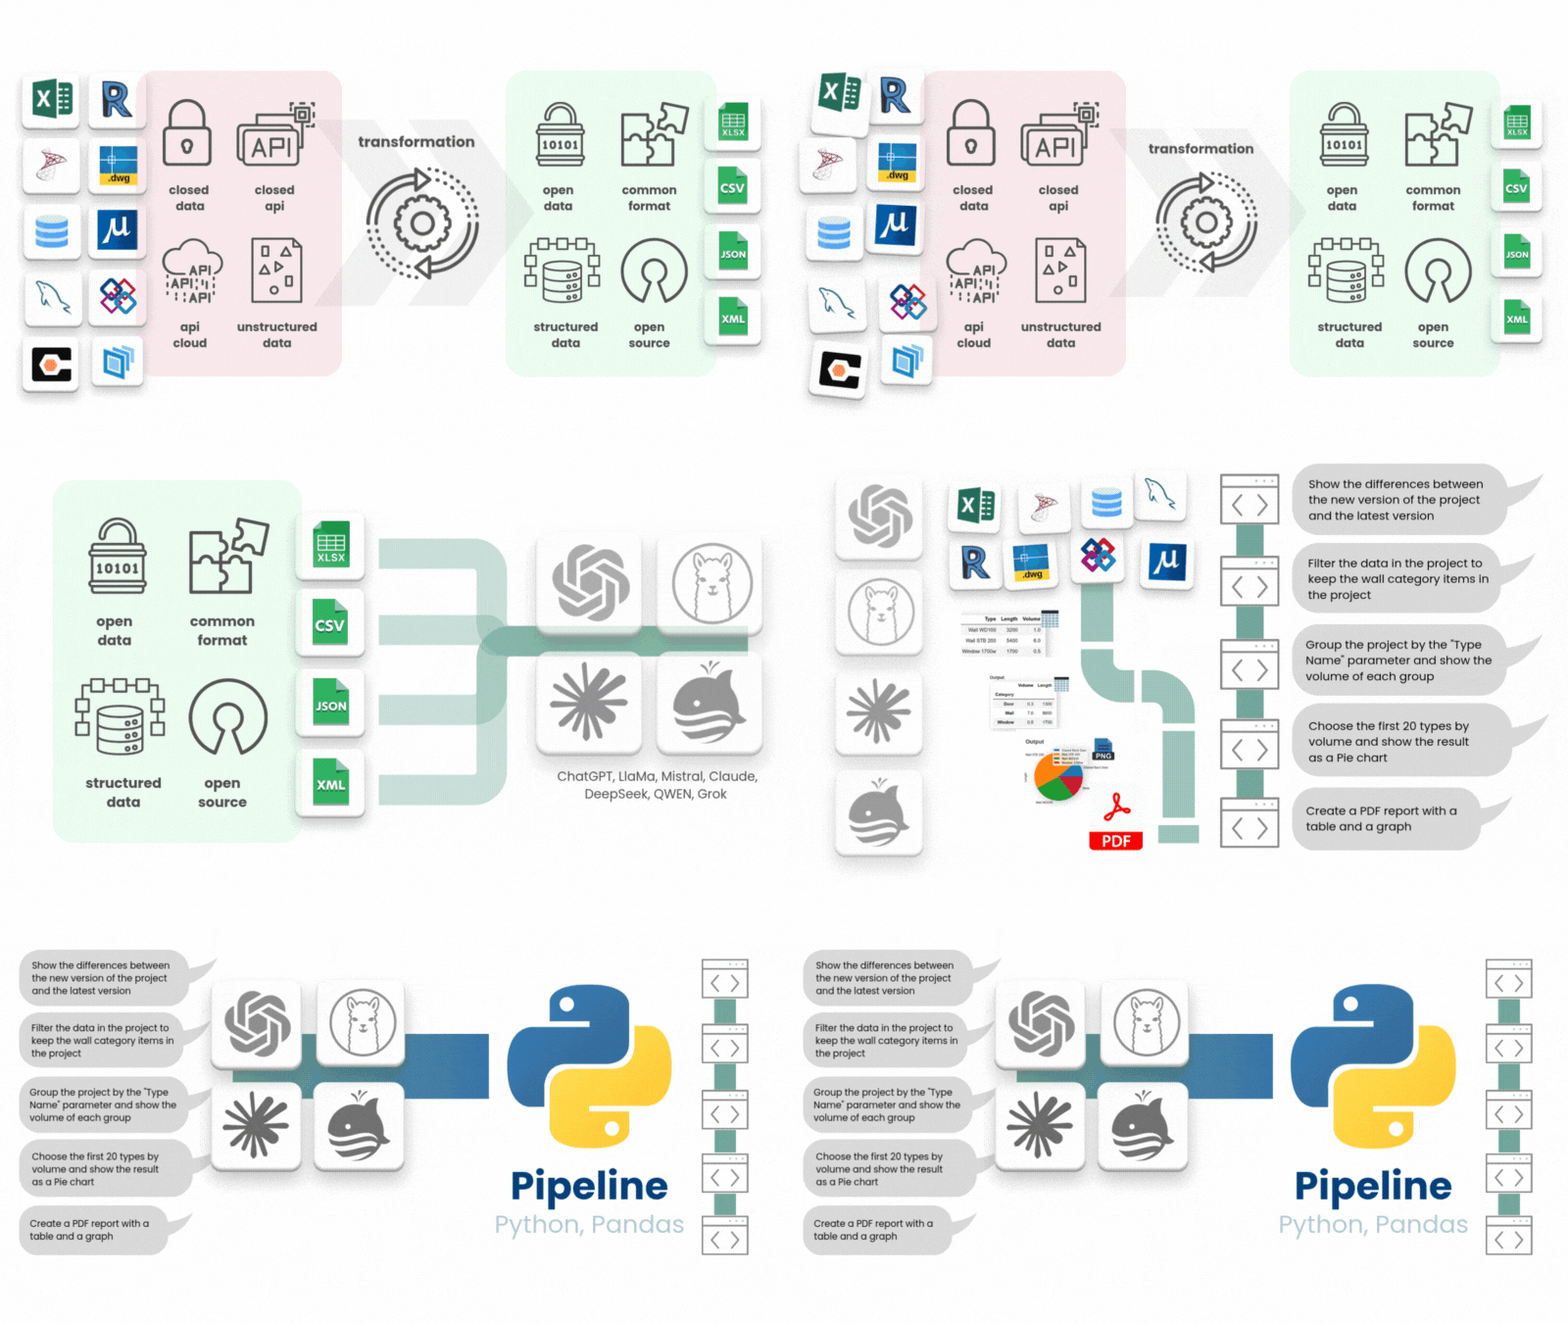
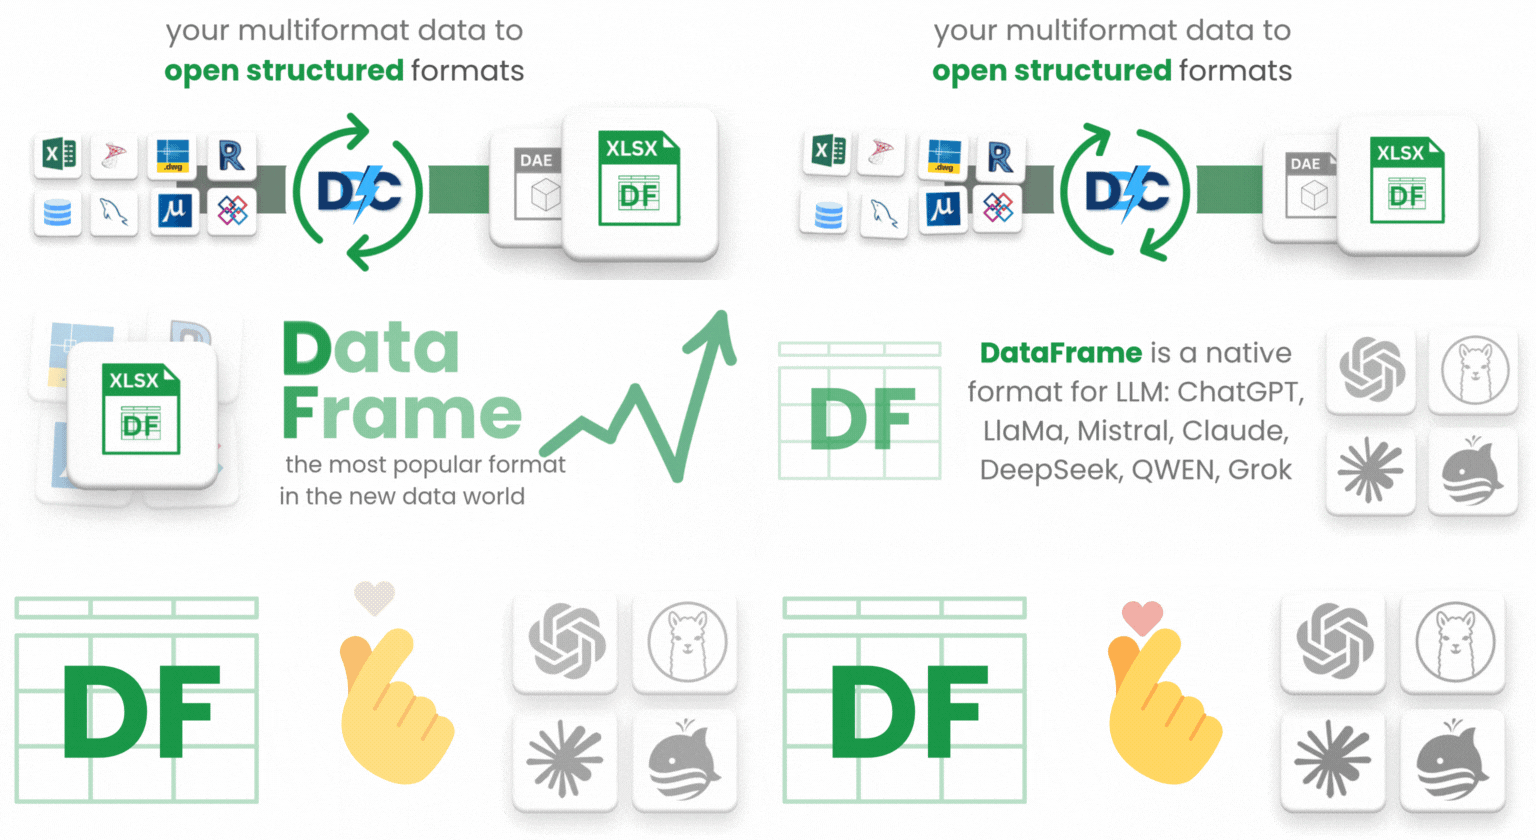
Structured data, organized in columns and rows, has become the backbone of modern storage and analysis systems due to its orderliness and ease of processing. For example, only one library - Pandas, that processes DataFrame data is loaded about 12 million times a day. Due to its popularity and ease of use, DataFrame has become the main format for data processing and automation in LLM tools.
Working with Business Data Using ChatGPT, LlaMa, Mistral, Claude, DeepSeek, QWEN, Grok
Small XLSX DataFrame
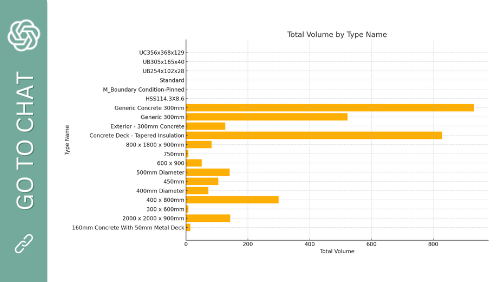
Ideal for DataFrames up to a few megabytes. If the project is relatively small—up to 500-1000 columns and tens of thousands of elements—then you can load the entire DataFram into ChatGPT, LlaMa, Mistral, Claude, DeepSeek, QWEN, Grok. This amount of data doesn’t exceed the model's limits, allowing you to work with, analyze, and visualize the data fully within ChatGPT.
Large XLSX DataFrame
If the DataFrame project is large and the file size is over 2 MB, you don't need to use the entire DataFrame in ChatGPT, LlaMa, Mistral, Claude, DeepSeek, QWEN, Grok. Instead, load only the first 5-10 rows. This will help the model understand the structure and parameters of the project, making it easier to generate code for analysis.
No File Upload Needed
For a quick prompt, you can simply describe the DataFrame structure and columns in ChatGPT, LlaMa, Mistral, Claude, DeepSeek, QWEN, Grok without uploading the file. For example, you could say, “I have a DataFrame and I need...,” and the model will generate the code you need. This approach yields ready-to-run code that you can test on a small sample and then run in any IDE with any data size.
Examples of using buisness data after conversion in LLM
Do BIM, openBIM, BIM Level 3, and noBIM actually exist
or are they marketing gimmicks?
Any business process in construction does not start with working in CAD (or BIM) tools. In any business process we first form the parameters of the task and define the requirements for future elements: we specify a list of entities, their initial characteristics and boundary values. This is usually done in the form of several columns of a table, database or lists of key-value pairs (step 1–2). These are the requirements for our project, which we get from various sources - from government standards to internal company rules, which are shaped by experience.

And only on the basis of these initial parameters, objects are automatically or manually created in CAD/BIM programs using API (step 3–4), after which they are again checked for comapliance with the initial requirements (5–6). This cycle — definition, creation, verification and correction (2–6) — is repeated until the data quality reaches the desired level for the target system — documents, tables or dashboards (7). If we consider CAD (BIM) as a way of transferring parameters, which are sets of keys and values originally generated outside the CAD environment (1-2), it becomes obvious that we are in fact working with a database of parameters (2-3, 5-6), which is augmented by various tools and at some point goes from simple requirements to a set of elements with parameters that in a CAD program are usually treated as a closed database.
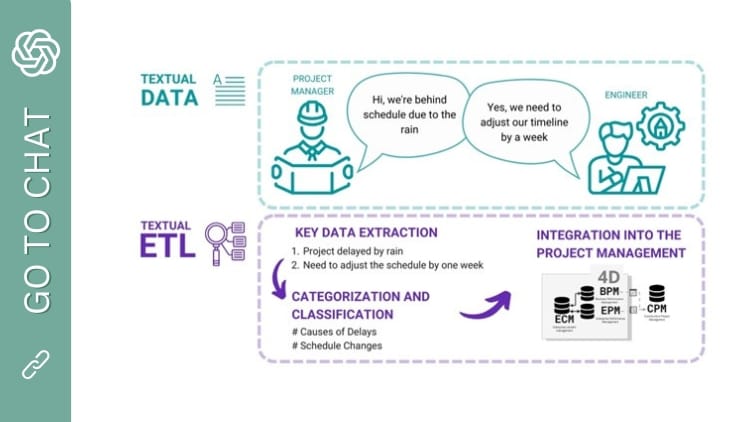
Approaching BIM through the lens of this definition, we find principles similar to those used in data analytics as well as ETL (extract, transform and load data) processes. LLM tools such as ChatGPT, LLaMa will play a major role in this process of data extraction and validation, which are tailored to data analytics processes
CAD (BIM) data processing in LLM
DataFrame or column-based Data
A DataFrame is a way of organizing data into a table very similar to the one you might see in Excel. In this table, the rows are individual records or entities, and the columns are the various characteristics or attributes of these item-entities.
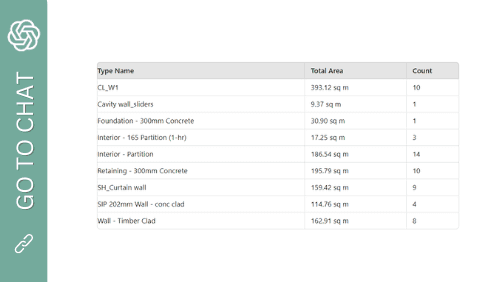
If we have a table with information about a construction project, the rows can represent the individual entities-elements of the project and the attributes-columns can represent their categories, parameters, position or coordinates of the BoundingBox elements.
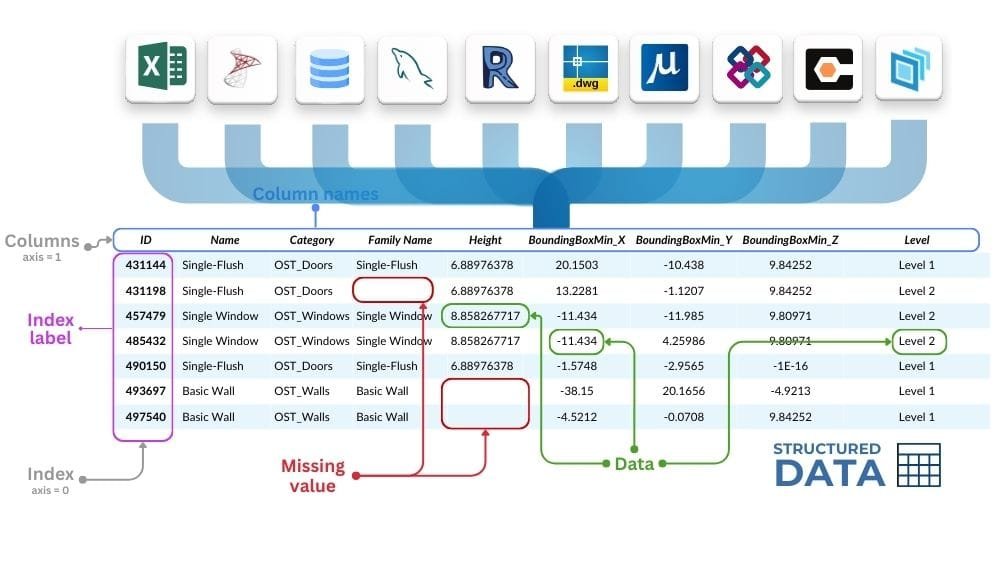
The transition from unmanaged data flow to its effective integration into business processes starts with converting data from closed formats to open formats. In information technology, open-source applications allow developers around the world to collaboratively improve software.
A major benefit of open data is its ability to remove the dependence of application developers on specific platforms to access data.
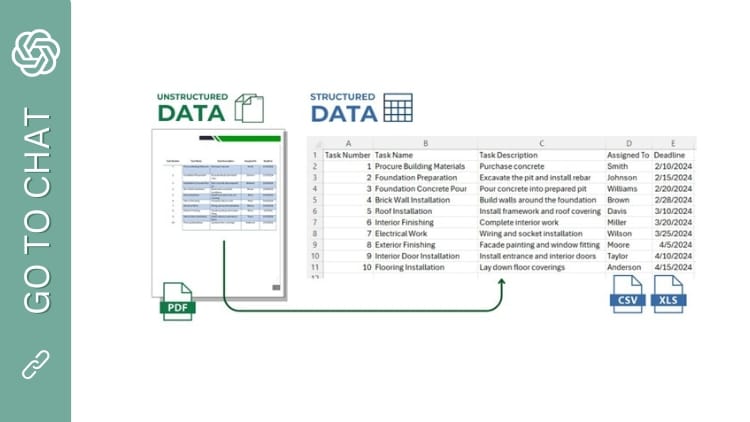
In the choice between open and closed data, experts obviously choose the open form of data, as is the preference for structured data in automation, processing and data warehousing processes (Figure 2.2-4). Open and structured data is often used by default in most systems because of its ease of processing and unambiguous interpretation, making it the most preferred type for communication and collaboration at the requirements and business process level.
