
")
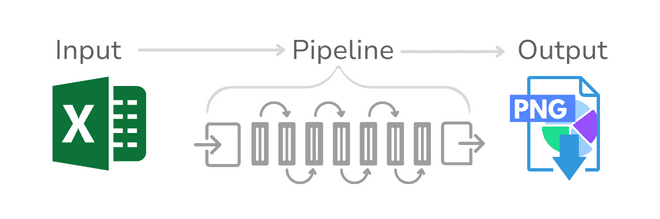
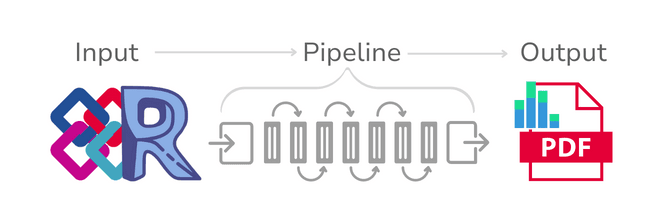
Pipeline empowers construction companies with process automation, utilizing open source code blocks and solutions borrowed from diverse industries
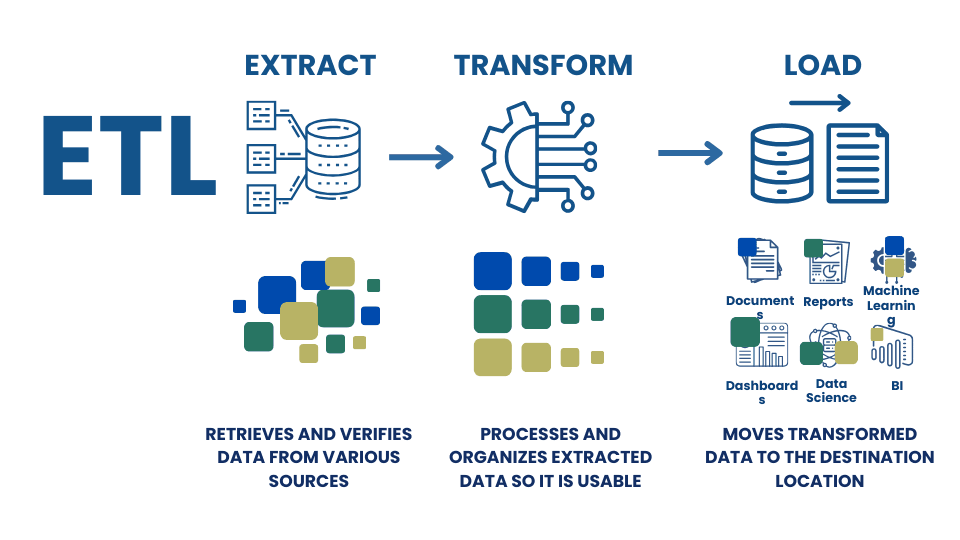
A traditional manual or semi-automated data process that replicates the ETL process involves a data manager or project manager who manually monitors the process and manually creates reports and documents on the process. Such traditional data processing methods take a significant amount of time in an environment where the workday is strictly limited to the time frame of 9:00 am to 5:00 pm.
In most cases, to automate such processes, companies buy ready-made ERP-like solutions, which are often customized to the company's individual desires and customized by an external developer, who ultimately determines the efficiency and effectiveness of the system and ultimately directly affects the business efficiency of the company that has purchased such a system.
In case a company is not ready to operate or buy a comprehensive ERP system where processes are performed in a semi-automated mode, one way or another the company's management will start automating the company's processes outside the ERP systems.
In the automated version of the same ETL workflow, the overall process looks like a modular code that starts with processing data and translating it into a open structured form. Once the structured data is received, various scripts or modules are automatically, on a schedule, run to check for changes, transform and send messages.
The reasons why I work more and
more with ETL-pipelines are simple

Simon Dilhas
CEO & Co-Founder
Abstract AG

A few years ago Data-Driven Construction team showed me Jupyter Notebooks and I fell in love.
Since then I do simple data manipulations quicker with a few lines of code instead of manually clicking in Excel. As always it was a gradual process, first I automated repeating tasks. As my confidence and know-how grows, I do more and more.
Moreover, with the advent of Chat GPT, it became even easier, by describing the desired outcome I get the code snippets and just need to adapt them.
It's saves me a lot of time. E.g. I have a list of new sign-ups and I have my company CRM. Once a month I check if all the signups are in the CRM. Before this was a manual comparison of two different lists. Now it's a press of a button and I get the list with the new signups in the right format to import it back to the CRM. By investing 1h of programming I'm saving 12h of work per year.
I reduce failures dramatically. Because I did not like to compare two lists I did not do it as regularly as I should have done it. Moreover, I'm not good at comparing data, every phone call disrupted my work and I forgot to change a data entry. The consequences were that not everybody who should have gotten my newsletter got it.
I feel like a god when I program. The more complex work becomes the less direct control over the results I have. But when programming I'm in absolute control of the result. I write a few lines of code and the computer executes them exactly as I tell him. When the result is not as I expected it to be, it's usually because of a logical shortcut on my side, the computer does exactly what I tell him.

WHAT DOES THE PROCESS
ETL-PIPELINE LOOK LIKE?
Manual process ~5 minutes
Pipeline runtime: ~5 seconds
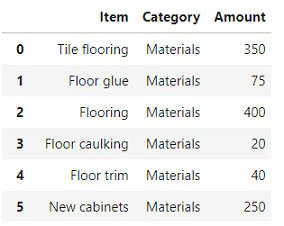
1. Extract: data opening
# Importing the necessary libraries
# for data manipulation and plotting

import pandas as pd
import matplotlib.pyplot as plt
# Address to the file received after conversion

DDCoutput_file = file_path[:-4] + "_rvt.xlsx"

# Reading the Excel file into a DataFrame (df)
df = pd.read_excel(DDCoutput_file)

# Show DataFrame table
df
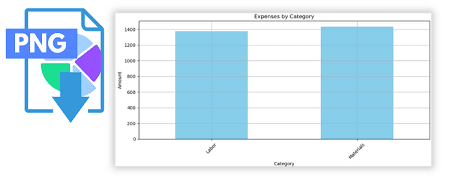
2. Transform: grouping and visualization
# Grouping by 'Category', summing
# the 'Amount', plotting the results, and adjusting the layout

ax = df.groupby('Category')['Amount'].sum().plot(kind='bar', figsize=(10, 5), color='skyblue', title='Expenses by Category', ylabel='Amount', rot=45, grid=True).get_figure()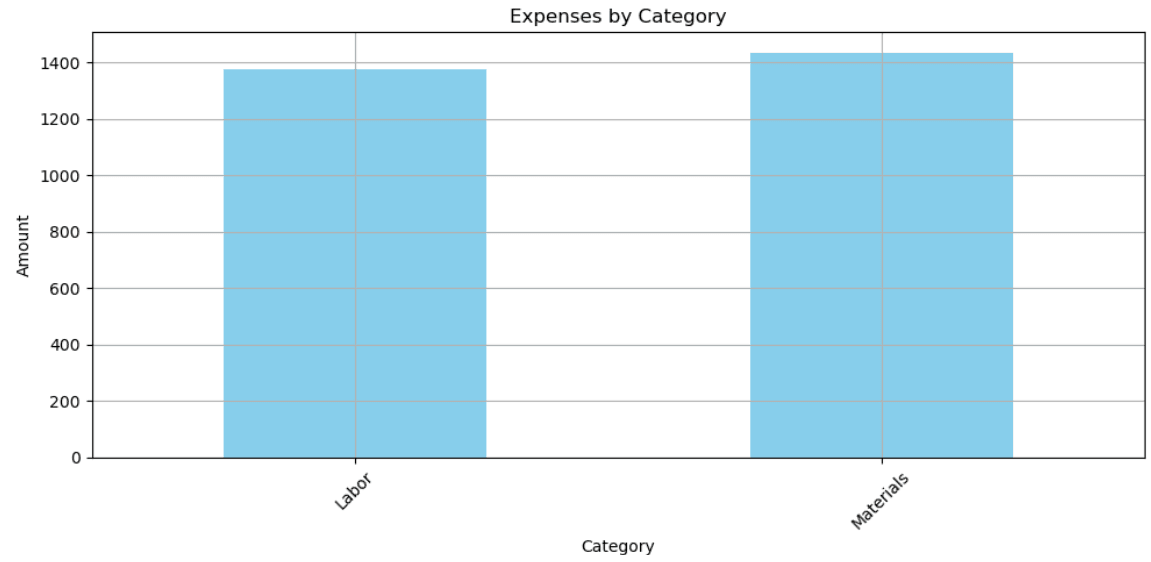
3. Load: export
# Specifying the path for saving
# the figure and saving the plot as a PNG file

file_path = "C:DDCexpenses_by_category.png"

plt.savefig(file_path)
Manual process ~20 minutes
Pipeline runtime: ~20 seconds
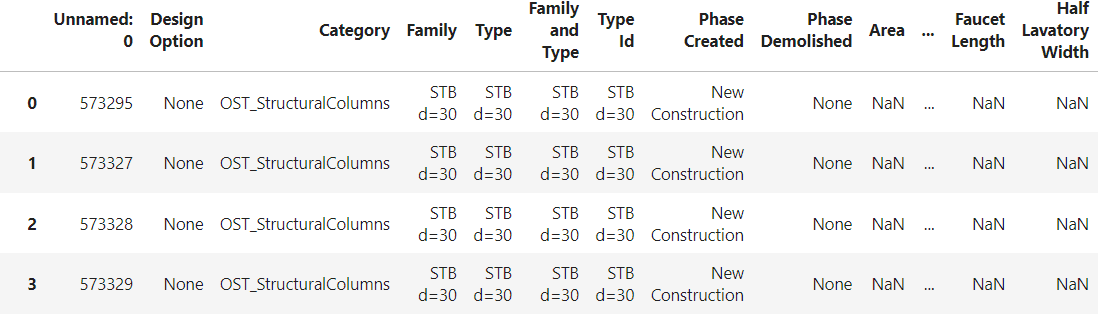
1. Extract: data opening
import converter as ddc
import pandas as pd
# Address to the file received after conversion

DDCoutput_file = file_path[:-4] + "_rvt.xlsx" th[:-4] + "_rvt.xlsx"

# Importing Revit and IFC data
df = pd.read_csv(DDCoutput_file )
df
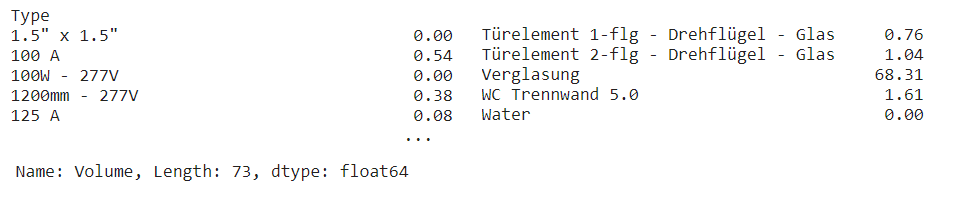
2.1 Transform: grouping and visualization
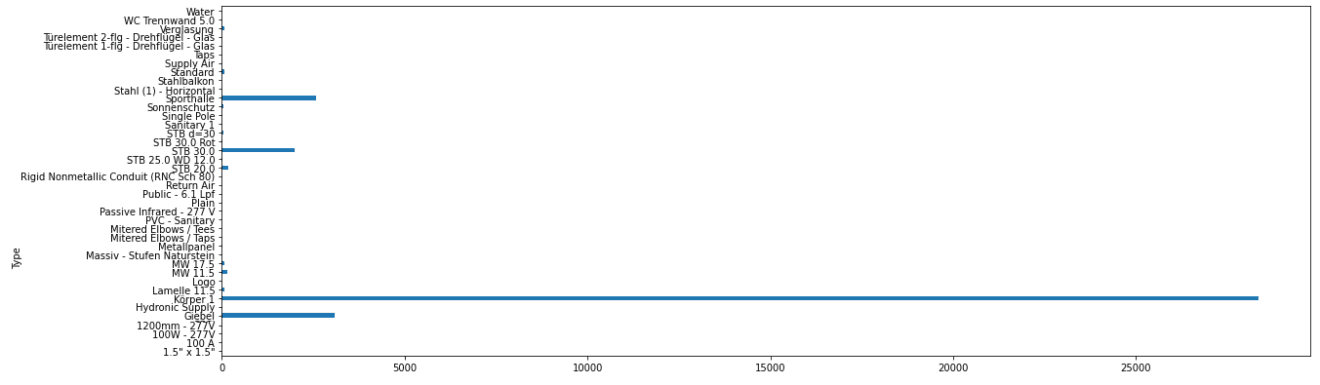
# Grouping a Revit or IFC project by parameters
dftable = df.groupby('Type')['Volume'].sum()
dftable
2.2 Transform: displaying
# Displaying a table as a graph
graph = dftable.plot(kind='barh', figsize=(20, 12))
# Save graph as PNG
graphtopng = graph.get_figure()
graphtopng.savefig('C:DDC_samplegraph_type.png', bbox_inches = 'tight')
3 Load: export
# Installing the library that allows generating PDF documents
!pip install fpdf
from fpdf import FPDF

# Creating a PDF document based on the parameters found
pdf = FPDF()
pdf.add_page()
pdf.set_font('Arial', 'B', 16)
pdf.cell(190, 8, 'Grouping of the entire project by Type parameter', 2, 1, 'C')
pdf.image('C:DDC_samplegraph_type.png', w = 180,  link = '')

# Saving a document in PDF format
pdf.output('Report_DataDrivenConstruction.pdf', 'F')


Every month fresh solutions and news in our social channels
Don't miss the new solutions
Relying solely on manual labor in the era of automation presents significant challenges
Inconsistency
Human interventions can lead to varied outcomes, often influenced by fatigue, oversight, or misunderstanding
Non-scalability
Manual processes can’t easily scale to handle large volumes of work or complex tasks without proportionally increasing resources or time
Time-Consuming
Manual tasks, especially repetitive ones, can be significantly slower than automated processes, leading to inefficiencies and delays
Utilizing a pipeline in data processing provides substantial benefits
Efficiency
Streamline data operations for faster and optimized execution
Consistency
Ensure uniform results across datasets with reproducible outcomes
Clarity
Structured code flow for easy understanding, debugging, and maintenance


