Dive into the Code
The Challenge
In the construction and design sector, professionals grapple with vast Excel datasets. Deciphering these numbers is daunting, especially as Excel's basic visual tools often fall short. The real challenge is efficiently transforming this complex Excel data into clear and universally understandable visual narratives.
Requirements
1. Python Environment
Installing Python
Why Python?
Python is an easy-to-learn, versatile programming language. It's the backbone of various data processing and machine learning libraries.
Steps to Install Python:
- Visit the official Python website.
- Click on the download link for the latest version of Python.
- Once downloaded, open the installer.
- IMPORTANT: Check the box that says "Add Python to PATH." This will allow you to run Python from the command prompt.
- Choose the "Install Now" option.
- Wait for the installation to complete and ensure there are no errors.
Verifying Installation:
- Open your command prompt or terminal.
- Type
python --versionand press Enter. - You should see the version of Python you installed. This confirms that Python was installed successfully.
Note: The detailed instructions above are primarily for Windows users. If you're using macOS or Linux, Python may already be installed. If not, the installation process is similar, but the interface will be different. Always refer to official documentation or seek platform-specific guides when needed.
2. Jupyter Notebook
Installing Jupyter Notebook
Why Jupyter Notebook?
Jupyter Notebook is an open-source application that allows you to create and share documents containing live code, equations, visualizations, and narrative text. It's great for data cleaning and transformation, numerical simulation, statistical modeling, and more.
Steps to Install Jupyter Notebook:
- Ensure you have Python installed. Jupyter Notebook runs on Python.
- Open your command prompt or terminal.
- Type
pip install notebookand press Enter to install Jupyter Notebook via pip, Python's package manager. - After installation, you can start Jupyter Notebook by typing
jupyter notebookin your terminal or command prompt. - Your default web browser will open displaying the Jupyter Notebook interface. From here, you can create new notebooks or open existing ones.
Using Jupyter Notebook:
- Once the Jupyter interface is open in your browser, click on "New" and select "Python 3" to create a new notebook.
- You can now start writing and executing Python code in the notebook cells. You can also add markdown for notes.
- Always remember to save your work. You can download the notebook in various formats, including .ipynb (Jupyter's format) and .pdf.
Note: If you encounter any issues or want to explore more features, refer to the official Jupyter Notebook documentation.
How It Works (Step-by-Step Pipeline)
1. Data opening
# Importing the necessary libraries
# for data manipulation and plotting
import pandas as pd
import matplotlib.pyplot as plt
# Reading the Excel file into a DataFrame (df)
df = pd.read_excel('C:DDCConstruction-Budget.xlsx')
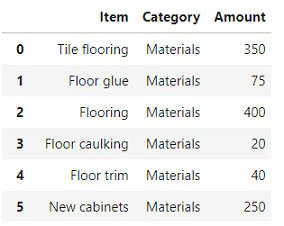
# Show DataFrame table
df
2. Grouping and visualization
# Grouping by 'Category', summing
# the 'Amount', plotting the results, and adjusting the layout

ax = df.groupby('Category')['Amount'].sum().plot(kind='bar', figsize=(10, 5), color='skyblue', title='Expenses by Category', ylabel='Amount', rot=45, grid=True).get_figure()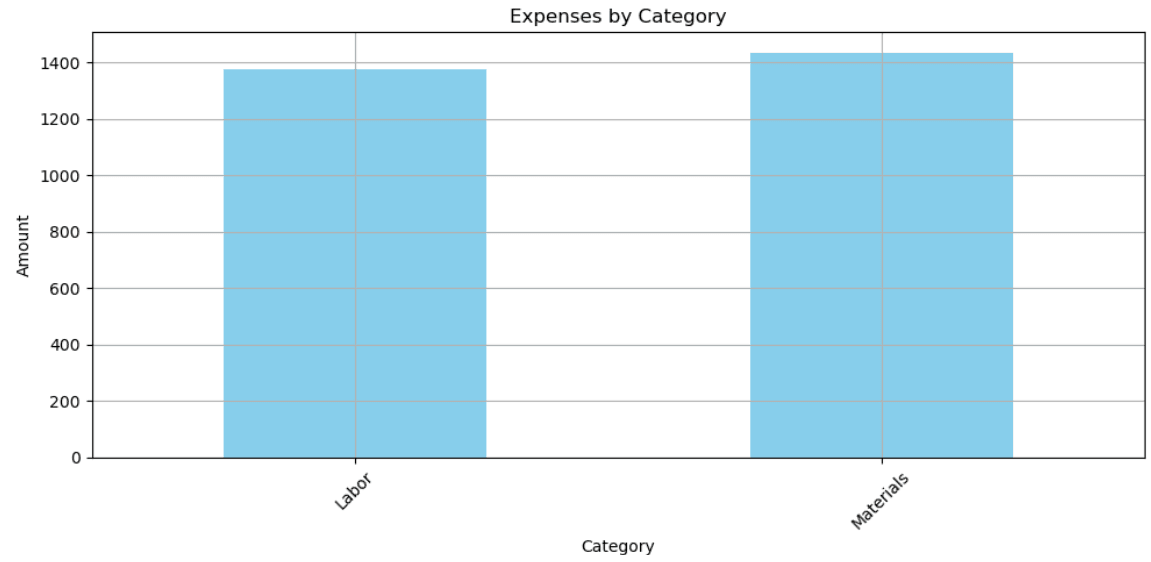
3. Export
# Specifying the path for saving
# the figure and saving the plot as a PNG file

file_path = "C:DDCexpenses_by_category.png"

plt.savefig(file_path)
Full Code
import pandas as pd
import matplotlib.pyplot as plt

# Reading the "ITEMIZED EXPENSES" sheet
itemized_expenses_df = pd.read_excel("https://datadrivenconstruction.io/wp-content/uploads/2023/08/Home-Construction-Budget.xlsx", sheet_name="ITEMIZED EXPENSES")

# Display the first few rows of the dataframe for review
itemized_expenses_head = itemized_expenses_df.head()

import matplotlib.pyplot as plt

# Grouping the expenses by category and summing the amounts
category_expenses = itemized_expenses_df.groupby("Category")["Amount"].sum()

# Pie chart visualization
plt.figure(figsize=(10, 7))
category_expenses.plot(kind="pie", autopct='%1.1f%%', startangle=90)
plt.title("Distribution of Expenses by Category")
plt.ylabel("")  # Remove the default ylabel for a cleaner look
plt.show()
Frequently asked questions
Dive into the Code
Facing Issues? Reach Out!
Offer support for any troubleshooting or advanced use-cases