Time resources of calculations for scheduling of works
22 February 2024
6D-8D from energy efficiency to safety assurance
22 February 2024

Construction schedules and 4D project data

A construction schedule is a visual representation of the plan for executing the various phases of a project. It is created from detailed calculations such as the one above, where each task-job is timed and sequenced.

To determine the dates for the construction schedule in a Gantt chart, we take the values of the time volume attribute for each item from the foundation block costing and multiply them by the number of blocks (in this case, concrete foundation blocks). This calculation gives the duration of each task. We then plot these durations on a timeline, starting from the project start date, to construct a graph and the result is a visual representation showing when each task should start and finish.

The schedule helps project managers and workers clearly understand when and in what sequence the various phases of construction should be performed, ensuring efficient use of resources and meeting deadlines.

Let's present the scheduling of work for the installation of three concrete foundation blocks using the costings from the table above, starting May 1, 2024.

Using the costing table from the example above, let's ask ChatGPT to schedule the installation of the 3 foundation block elements from the first of May 2024. In order to send the costings to ChatGPT, we can either upload the costings table in XLSX format or simply insert a screenshot of the costings. ChatGPT will independently find a library to visualize the graph and by multiplying the time attributes of works from table by their volume will add all the data into a graph.


❏ Text request to ChatGPT:

Construct a schedule of work using the costings from the table to install 3 pieces of foundation block beginning 01/05/2024. ⏎


➤ ChatGPT Answer:
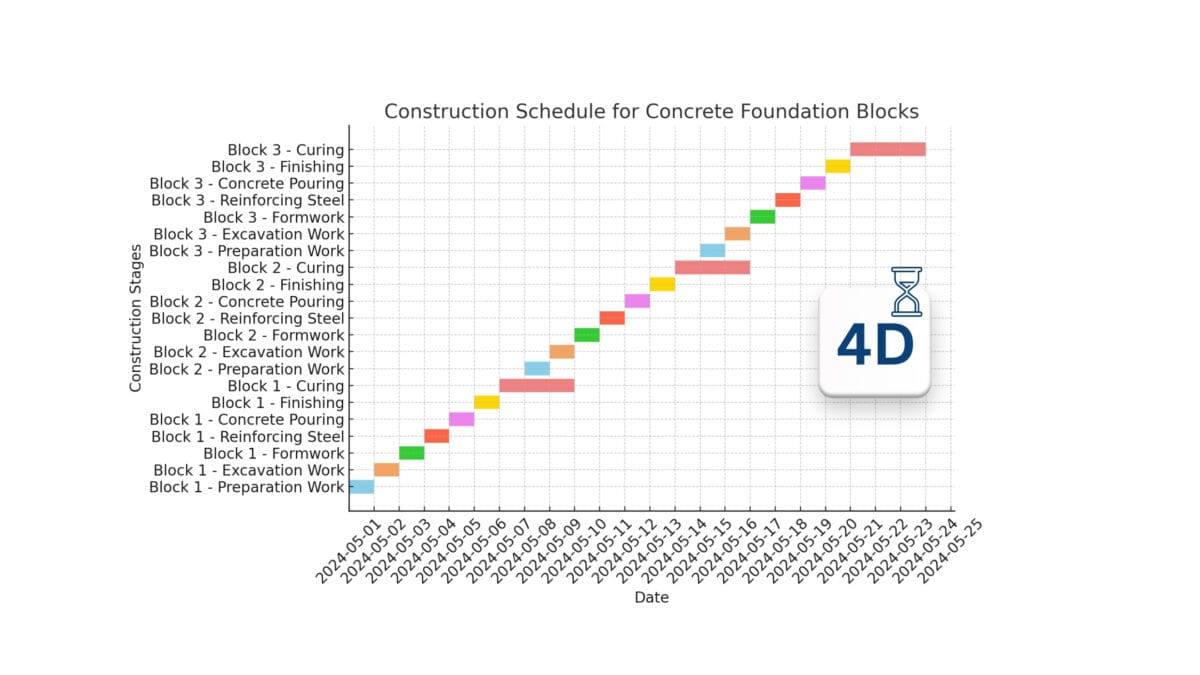
The resulting graph is divided into horizontal bars, where each bar corresponds to a certain stage of work on the block. The colors distinguish the stages such as preparation, excavation, formwork, reinforcement, concrete pouring, finishing work and concrete curing. The duration of each stage is shown by the length of the corresponding-colored bar on the graph.

This schedule not only helps to estimate how long each phase will take, but also shows how work on one block overlaps with work on another. For example, when concrete pouring for the first block is finished, preparations for the installation of the second block begin. This scheduling method allows for optimal allocation of labor and equipment, reducing overall project completion time and improving site efficiency.

Using costing, we can, thanks to the attributes of volumes from 3D geometries, automatically calculate the time characteristics of groups in the form of tables or graphs for different project variants
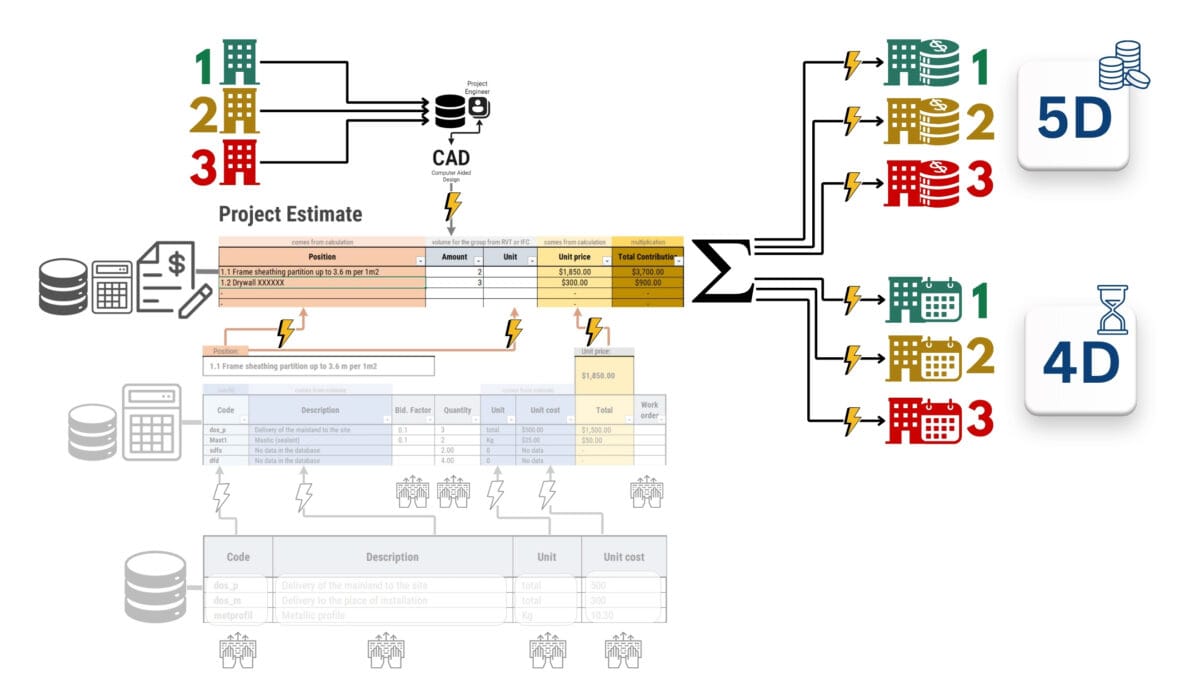
Modern ERP systems employ automated methods for calculating time, which substantially shorten the decision-making process. This enables swift and precise planning of work schedules and the computation of the total time required for completing project tasks.

Leave a Reply

Change language

Post's Highlights

Stay updated: news and insights


We’re Here to Help

Fresh solutions are released through our social channels

UNLOCK THE POWER OF DATA
 IN CONSTRUCTION

Dive into the world of data-driven construction with this accessible guide, perfect for professionals and novices alike.
From the basics of data management to cutting-edge trends in digital transformation, this book
will be your comprehensive guide to using data in the construction industry.

Related posts 

Focus Areas

Search

Search
Sorry, no articles found.

Don't miss the new solutions


Linux

macOS

Looking for the Linux or MAC version? Send us a quick message using the button below, and we’ll guide you through the process!


📥 Download OnePager

Welcome to DataDrivenConstruction—where data meets innovation in the construction industry. Our One-Pager offers a concise overview of how our data-driven solutions can transform your projects, enhance efficiency, and drive sustainable growth. 

🚀 Welcome to the future of data in construction!

You're taking your first step into the world of open data, working with normalized, structured data—the foundation of data analytics and modern automation tools.

By downloading, you agree to the DataDrivenConstruction terms of use 

Stay ahead with the latest updates on converters, tools, AI, LLM
and data analytics in construction — Subscribe now!

🚀 Welcome to the future of data in construction!

You're taking your first step into the world of open data, working with normalized, structured data—the foundation of data analytics and modern automation tools.

By downloading, you agree to the DataDrivenConstruction terms of use 

Stay ahead with the latest updates on converters, tools, AI, LLM
and data analytics in construction — Subscribe now!

🚀 Welcome to the future of data in construction!

You're taking your first step into the world of open data, working with normalized, structured data—the foundation of data analytics and modern automation tools.

By downloading, you agree to the DataDrivenConstruction terms of use 

Stay ahead with the latest updates on converters, tools, AI, LLM
and data analytics in construction — Subscribe now!

🚀 Welcome to the future of data in construction!

You're taking your first step into the world of open data, working with normalized, structured data—the foundation of data analytics and modern automation tools.

By downloading, you agree to the DataDrivenConstruction terms of use 

Stay ahead with the latest updates on converters, tools, AI, LLM
and data analytics in construction — Subscribe now!

🚀 Welcome to the future of data in construction!

You're taking your first step into the world of open data, working with normalized, structured data—the foundation of data analytics and modern automation tools.

By downloading, you agree to the DDC terms of use 

🚀 Welcome to the future of data in construction!

You're taking your first step into the world of open data, working with normalized, structured data—the foundation of data analytics and modern automation tools.

By downloading, you agree to the DataDrivenConstruction terms of use 

Stay ahead with the latest updates on converters, tools, AI, LLM
and data analytics in construction — Subscribe now!

DataDrivenConstruction offers workshops tested and practiced on global leaders in the construction industry to help your team navigate and leverage the power of data and artificial intelligence in your company's decision making.

Reserve your spot now to rethink your
approach to decision making!


🚀 Welcome to the future of data in construction!

By downloading, you agree to the DataDrivenConstruction terms of use 

Stay ahead with the latest updates on converters, tools, AI, LLM
and data analytics in construction — Subscribe now!

Have a question or need more information? Reach out to us directly!
Schedule a time to discuss your needs with our team.
Tailored sessions to help your team grow — let's plan together!
Have you attended one of our workshops, read our book, or used our solutions? Share your thoughts with us!
Name
Data Maturity Diagnostics

🧰 Data-Driven Readiness Check

This short assessment will help you identify your company's data management pain points and offer solutions to improve project efficiency. It takes only 1–2 minutes to complete and you will receive personalized recommendations tailored to your needs.

Clean & Organized Data

Theoretical Chapters:

Practical Chapters:

What You'll Find on
DDC Solutions:

  • CAD/BIM to spreadsheet/database converters (Revit, AutoCAD, IFC, Microstation)
  • Ready-to-deploy n8n workflows for construction processes
  • ETL pipelines for data synchronization between systems
  • Customizable Python scripts for repetitive tasks
  • Intelligent data validation and error detection
  • Real-time dashboard connectors
  • Automated reporting systems

Connect Everything

Theoretical Chapters:

Practical Chapters:

What You'll Find on
DDC Solutions:

  • CAD/BIM to spreadsheet/database converters (Revit, AutoCAD, IFC, Microstation)
  • Ready-to-deploy n8n workflows for construction processes
  • ETL pipelines for data synchronization between systems
  • Customizable Python scripts for repetitive tasks
  • Intelligent data validation and error detection
  • Real-time dashboard connectors
  • Automated reporting systems

Add AI & LLM Brain

Theoretical Chapters:

Practical Chapters:

What You'll Find on
DDC Solutions:

  • CAD/BIM to spreadsheet/database converters (Revit, AutoCAD, IFC, Microstation)
  • Ready-to-deploy n8n workflows for construction processes
  • ETL pipelines for data synchronization between systems
  • Customizable Python scripts for repetitive tasks
  • Intelligent data validation and error detection
  • Real-time dashboard connectors
  • Automated reporting systems
Construction schedules and 4D project data
This website uses cookies to improve your experience. By using this website you agree to our Data Protection Policy.
Read more
×