image100
070 Verification of data and results of verification
13 February 2025
072 Comparison of data quality checks with human life needs
15 February 2025

071 Visualization of verification results

Visualization is an essential tool for interpreting inspection results. In addition to the usual summary tables, it can include dashboards, diagrams, and automatically generated PDF documents that group project elements by inspection status. Color coding can play a supporting role here: green can indicate items that have been successfully validated, yellow can indicate items that require additional attention, and red can indicate items that have critical errors or are missing key data.

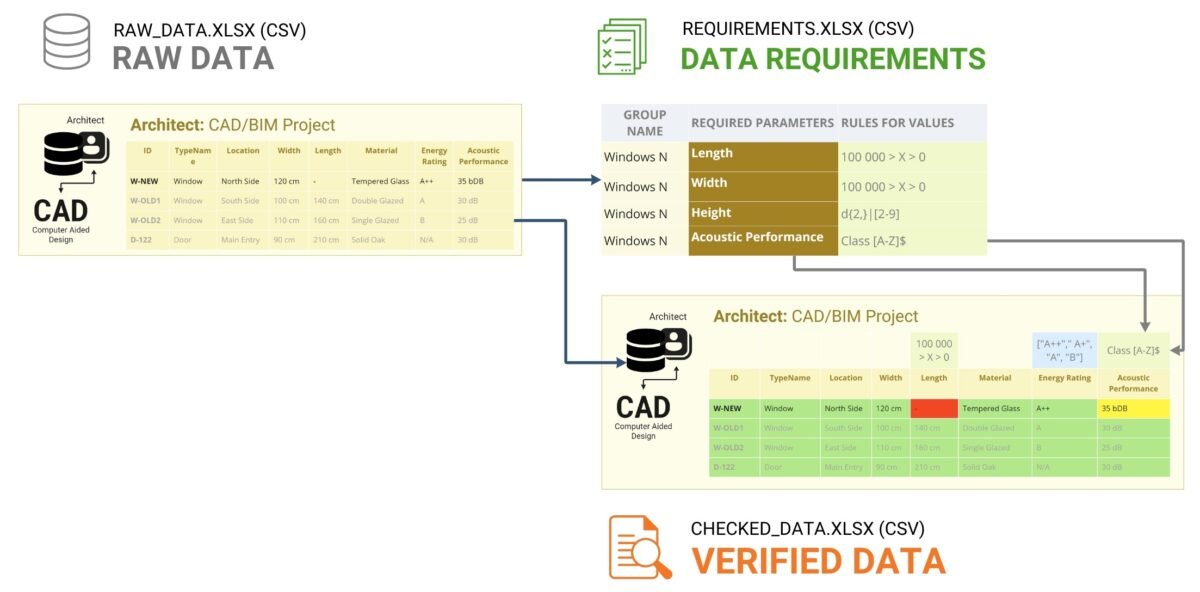
In our example (Fig.‎ 4.4-1), we analyze data from each system step by step: from CAD (BIM) and real estate management to logistics and installation schedules (Fig.‎ 4.4-16). Based on the audit results, individual alerts or report documents are automatically generated for each specialist, e.g. in PDF format (Fig.‎ 4.4-17). If the data are correct, the specialist receives a brief message: “Thank you for working together”. If discrepancies are detected, a detailed report is sent with the wording: “This document lists elements, their identifiers, attributes and values that have not been checked for compliance”.
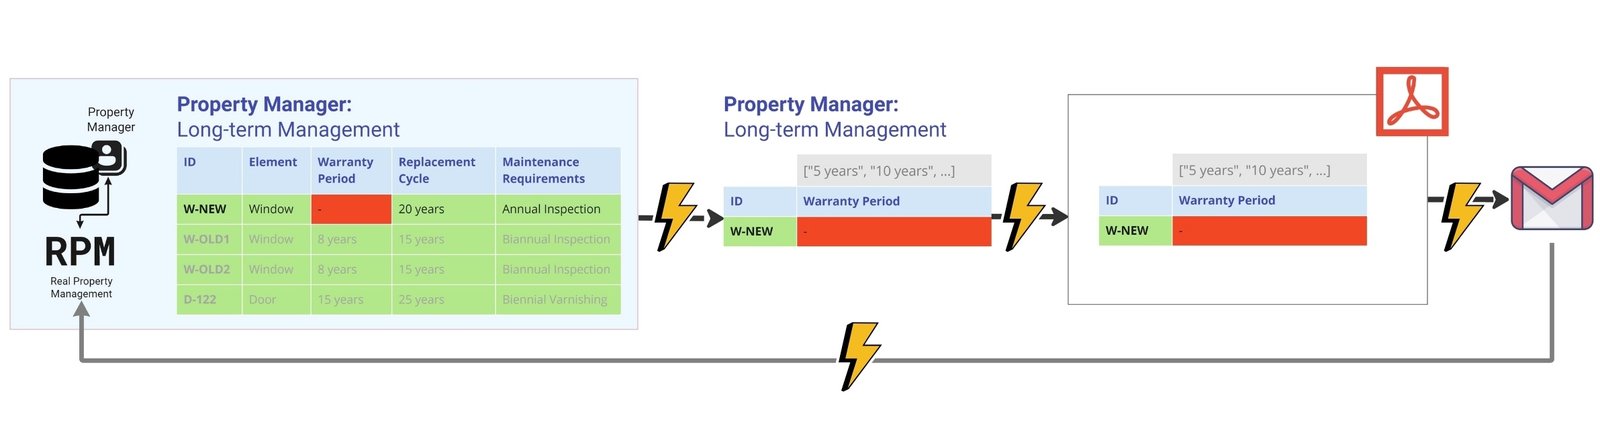
image69
Fig. 4.4-17 Validation and automatic report generation speeds the process of finding and understanding data deficiencies for the professional who creates the data.

Thanks to the automated validation process – as soon as an error or data gap is detected, an instant notification is sent in the form of a chat message, e-mail or PDF -document to the person responsible for creating or processing the relevant entities and their attributes (Fig.‎ 4.4-18), with a list of elements and attribute descriptions that failed the validation.
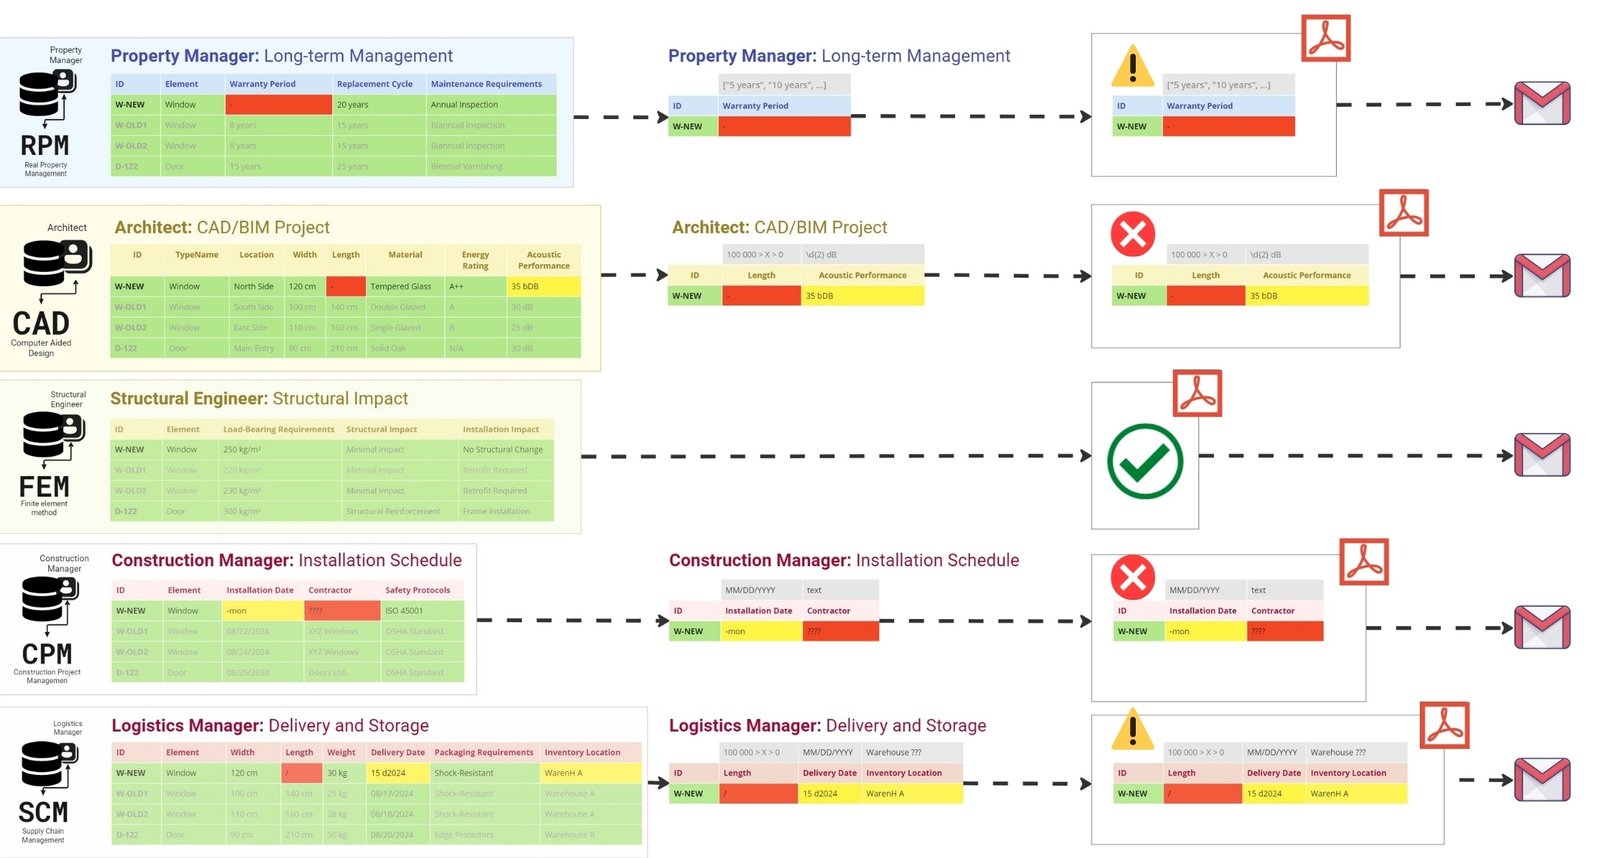
image107
Fig.‎ 4.4-18 Automated inspection reports make it easier to understand errors and speed up the work of completing project data.

For example, if a document arrives in the property management system (after structuring) with the Warranty Period attribute incorrectly filled in, the property manager receives an alert with a list of attributes that need to be checked and corrected.

Similarly, any deficiencies in the installation schedule or logistics data will result in an automatic report being generated and, for example, a chat notification or an e-mail with the results of the inspection being sent to the relevant specialist.

In addition to PDF -documents and graphs with results, it is possible to create dashboards and interactive 3D -models (Fig. 7.1-6, Fig. 7.2-12) highlighting elements with missing attributes, allowing users to visually utilize 3D element geometries to filter and evaluate the quality and completeness of these elements in the project.

Visualizing inspection results in the form of automatically generated documents, graphs or dashboards greatly simplifies data interpretation and facilitates effective communication between project participants.

The process of automatically checking data from various systems and information sources can be compared to informed decision-making in everyday life. Just as companies in the construction industry consider many variables – from the reliability of input data to their impact on the timing, cost, and quality of project implementation – so too, when making important decisions, for example, when choosing a place to live, a person weighs a number of factors: transportation accessibility, infrastructure, cost, safety, and quality of life. All of these considerations form a system of criteria, on the basis of which the final decisions that make up our lives are made.

.

Leave a Reply

Change language

Post's Highlights

Stay updated: news and insights


We’re Here to Help

Fresh solutions are released through our social channels

UNLOCK THE POWER OF DATA
 IN CONSTRUCTION

Dive into the world of data-driven construction with this accessible guide, perfect for professionals and novices alike.
From the basics of data management to cutting-edge trends in digital transformation, this book
will be your comprehensive guide to using data in the construction industry.

Related posts 

Focus Areas

Search

Search
Sorry, no articles found.

✕

Don't miss the new solutions


✕
✕

Linux

macOS

Looking for the Linux or MAC version? Send us a quick message using the button below, and we’ll guide you through the process!

✕

📥 Download OnePager

Welcome to DataDrivenConstruction—where data meets innovation in the construction industry. Our One-Pager offers a concise overview of how our data-driven solutions can transform your projects, enhance efficiency, and drive sustainable growth. 

✕

🚀 Welcome to the future of data in construction!

You're taking your first step into the world of open data, working with normalized, structured data—the foundation of data analytics and modern automation tools.

By downloading, you agree to the DataDrivenConstruction terms of use 

Stay ahead with the latest updates on converters, tools, AI, LLM
and data analytics in construction — Subscribe now!

✕

🚀 Welcome to the future of data in construction!

You're taking your first step into the world of open data, working with normalized, structured data—the foundation of data analytics and modern automation tools.

By downloading, you agree to the DataDrivenConstruction terms of use 

Stay ahead with the latest updates on converters, tools, AI, LLM
and data analytics in construction — Subscribe now!

✕

🚀 Welcome to the future of data in construction!

You're taking your first step into the world of open data, working with normalized, structured data—the foundation of data analytics and modern automation tools.

By downloading, you agree to the DataDrivenConstruction terms of use 

Stay ahead with the latest updates on converters, tools, AI, LLM
and data analytics in construction — Subscribe now!

✕

🚀 Welcome to the future of data in construction!

You're taking your first step into the world of open data, working with normalized, structured data—the foundation of data analytics and modern automation tools.

By downloading, you agree to the DataDrivenConstruction terms of use 

Stay ahead with the latest updates on converters, tools, AI, LLM
and data analytics in construction — Subscribe now!

✕

🚀 Welcome to the future of data in construction!

You're taking your first step into the world of open data, working with normalized, structured data—the foundation of data analytics and modern automation tools.

By downloading, you agree to the DDC terms of use 

✕

🚀 Welcome to the future of data in construction!

You're taking your first step into the world of open data, working with normalized, structured data—the foundation of data analytics and modern automation tools.

By downloading, you agree to the DataDrivenConstruction terms of use 

Stay ahead with the latest updates on converters, tools, AI, LLM
and data analytics in construction — Subscribe now!

✕
DataDrivenConstruction offers workshops tested and practiced on global leaders in the construction industry to help your team navigate and leverage the power of data and artificial intelligence in your company's decision making.

Reserve your spot now to rethink your
approach to decision making!

✕


🚀 Welcome to the future of data in construction!

By downloading, you agree to the DataDrivenConstruction terms of use 

Stay ahead with the latest updates on converters, tools, AI, LLM
and data analytics in construction — Subscribe now!

✕
Have a question or need more information? Reach out to us directly!
Schedule a time to discuss your needs with our team.
Tailored sessions to help your team grow — let's plan together!
✕
Have you attended one of our workshops, read our book, or used our solutions? Share your thoughts with us!
Name
✕
Data Maturity Diagnostics

🧰 Data-Driven Readiness Check

This short assessment will help you identify your company's data management pain points and offer solutions to improve project efficiency. It takes only 1–2 minutes to complete and you will receive personalized recommendations tailored to your needs.

✕

Clean & Organized Data

Theoretical Chapters:

Practical Chapters:

What You'll Find on
DDC Solutions:

  • CAD/BIM to spreadsheet/database converters (Revit, AutoCAD, IFC, Microstation)
  • Ready-to-deploy n8n workflows for construction processes
  • ETL pipelines for data synchronization between systems
  • Customizable Python scripts for repetitive tasks
  • Intelligent data validation and error detection
  • Real-time dashboard connectors
  • Automated reporting systems
✕

Connect Everything

Theoretical Chapters:

Practical Chapters:

What You'll Find on
DDC Solutions:

  • CAD/BIM to spreadsheet/database converters (Revit, AutoCAD, IFC, Microstation)
  • Ready-to-deploy n8n workflows for construction processes
  • ETL pipelines for data synchronization between systems
  • Customizable Python scripts for repetitive tasks
  • Intelligent data validation and error detection
  • Real-time dashboard connectors
  • Automated reporting systems
✕

Add AI & LLM Brain

Theoretical Chapters:

Practical Chapters:

What You'll Find on
DDC Solutions:

  • CAD/BIM to spreadsheet/database converters (Revit, AutoCAD, IFC, Microstation)
  • Ready-to-deploy n8n workflows for construction processes
  • ETL pipelines for data synchronization between systems
  • Customizable Python scripts for repetitive tasks
  • Intelligent data validation and error detection
  • Real-time dashboard connectors
  • Automated reporting systems
071 Visualization of verification results
This website uses cookies to improve your experience. By using this website you agree to our Data Protection Policy.
Read more
×