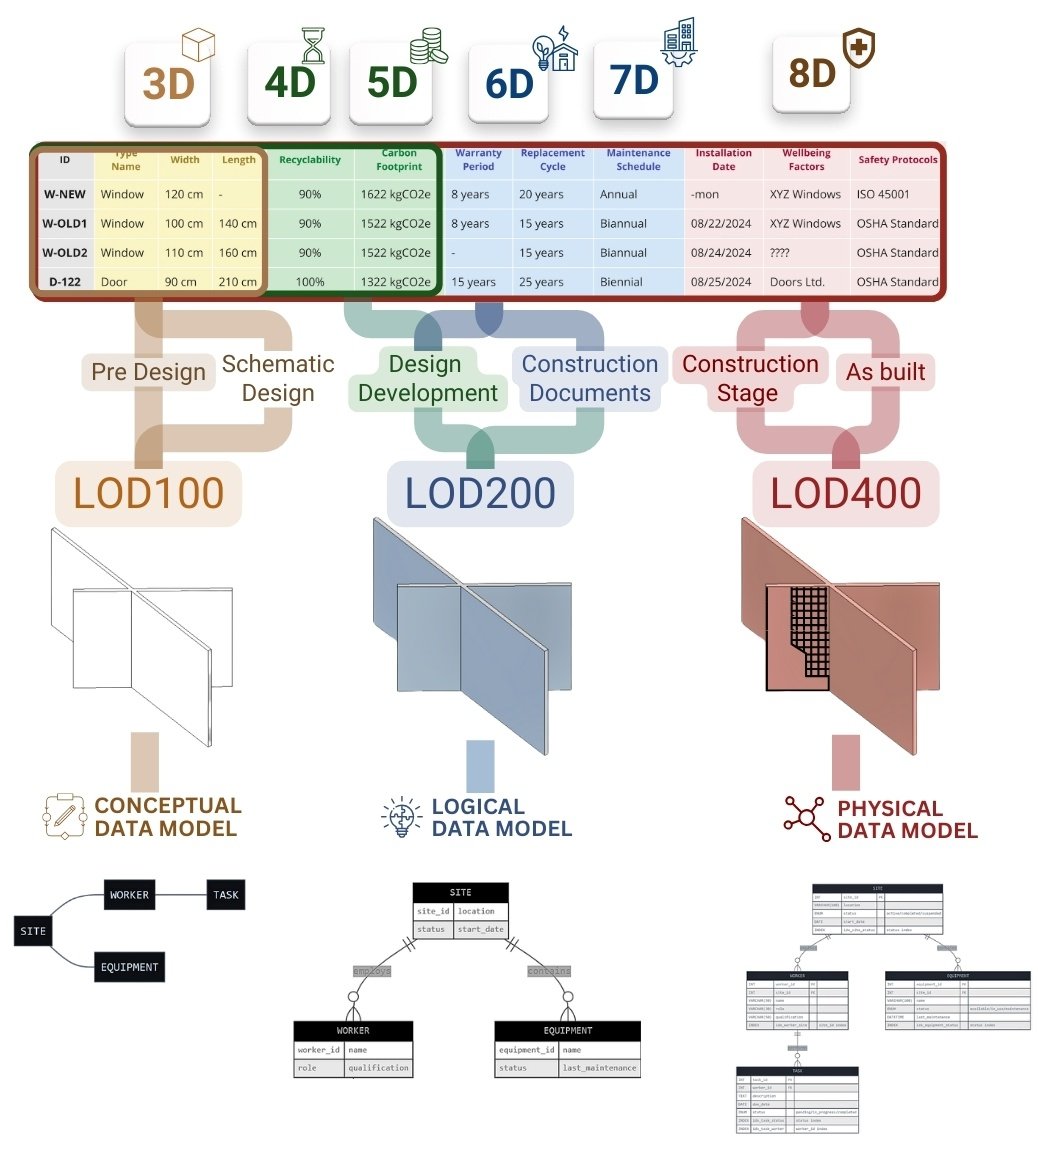

103 When lines turn into money or why builders need geometry
21 March 2025
Рисунок 30
105 Moving to MESH, USD and polygons using tessellation for geometry
23 March 2025

104 From lines to volumes How area and volume become data

In engineering practice, volumes and areas are computed from geometric surfaces described analytically or through parametric models such as NURBS (nonuniform rational B-splines) within the BREP (boundary element representation) framework.

NURBS (Non-Uniform Rational B-Splines) is a mathematical way of describing curves and surfaces, whereas BREP is a framework for describing the complete three-dimensional geometry of an object, including its boundaries, which can be defined using NURBS.

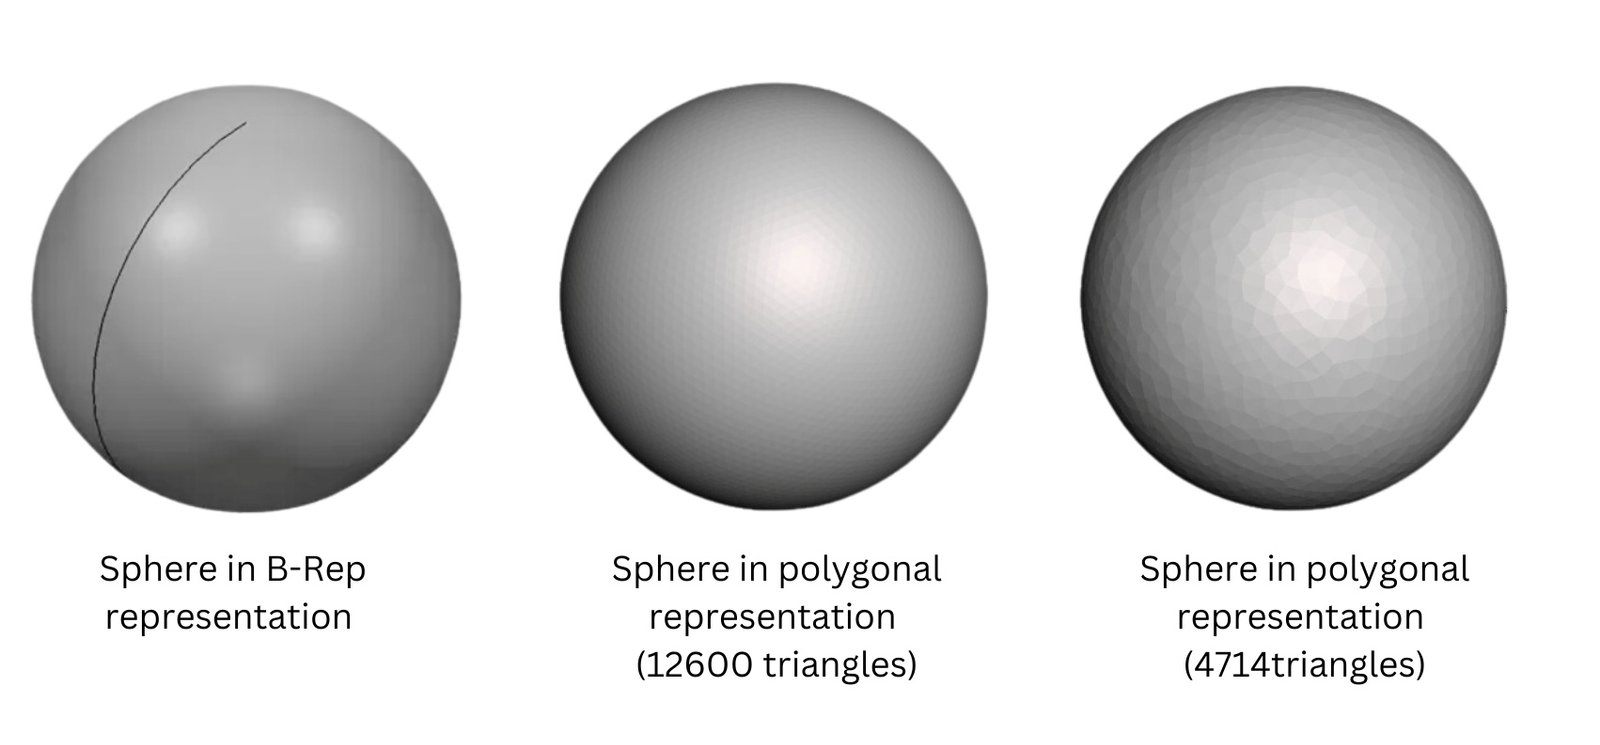
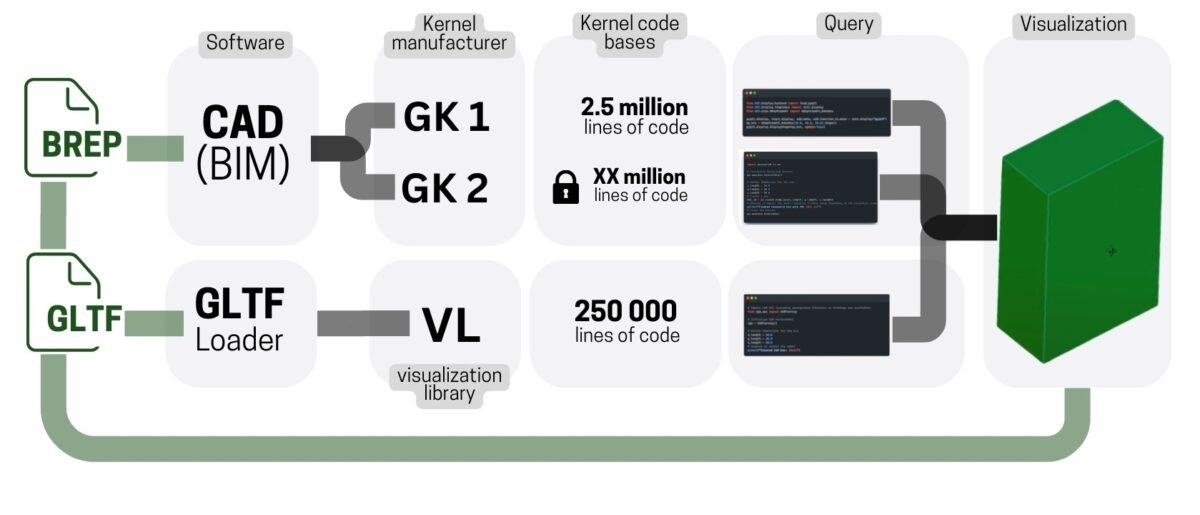
Despite the accuracy of BREP and NURBS, they require powerful computational resources and complex algorithms. However, direct computation from such mathematically accurate descriptions is often computationally difficult, so in practice, tessellation – the transformation of surfaces into a grid of triangles – is almost always used, which simplifies subsequent computations. Tessellation is the partitioning of a complex surface into triangles or polygons. In CAD /CAE environments this method is used for visualization, volume calculations, collision search, export to formats like MESH and collision analysis. An example from nature is bee honeycomb, where a complex shape is broken down into a regular grid (Fig.‎ 6.3-1).

Рисунок 34
Fig.‎ 6.3-1 The same sphere in parametric description BREP and polygonal representation with different number of triangles.

BREP (NURBS), used in CAD, is not a fundamental model of geometry. It was created as a convenient tool for representing circles and rational splines and for minimizing the storage of geometry data. However, it has limitations – for example, the inability to accurately describe the sinusoid that underlies helical lines and surfaces, and the need for complex geometry kernels.

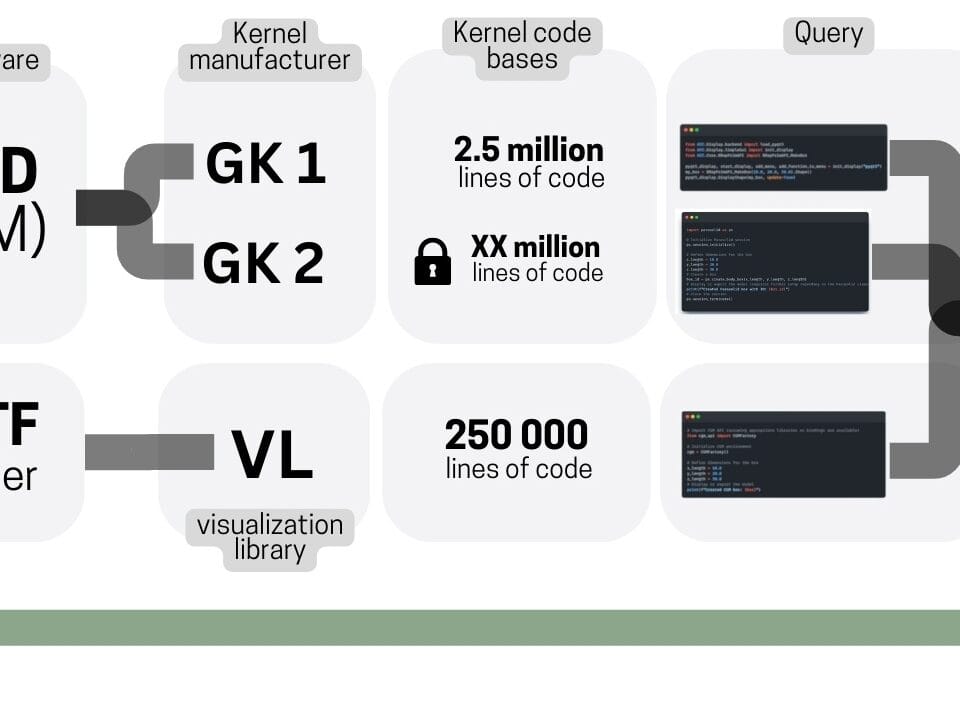
In contrast, triangular meshes and tessellation of parametric shapes are characterized by simplicity, efficient use of memory and ability to process large amounts of data (Fig.‎ 6.3-2). These advantages make it possible to do without complex and expensive geometry kernels, and the tens of millions of lines of code embedded in them, when calculating geometric shapes.

In most building cases it does not matter how exactly the volumetric characteristics are defined – through parametric models (BREP, IFC) or through polygons (USD, glTF, DAE, OBJ). The geometry remains the form of approximation: whether through NURBS or MESH, it is always an approximate description of the shape.

Geometry defined as polygons or BREP (NURBS) remains to some extent only a way of approximating with an approximate description of a continuous form. Just as Fresnel integrals have no exact analytic expression, discretizing geometry through polygons or NURBS is always an approximation, just as triangular MESH.

Parametric geometry in BREP format is necessary mainly where minimal data size is important and it is possible to use resource-intensive and expensive geometry kernels for its processing and display. Most often it is characteristic for developers of CAD -programs, which for this purpose apply in their products geometrical kernels of MCAD -vendors. At the same time, even within these programs, BREP-models in the process of tessellation for visualization and calculations are often converted into triangles (similar to the way PSD-files are simplified into JPEG).
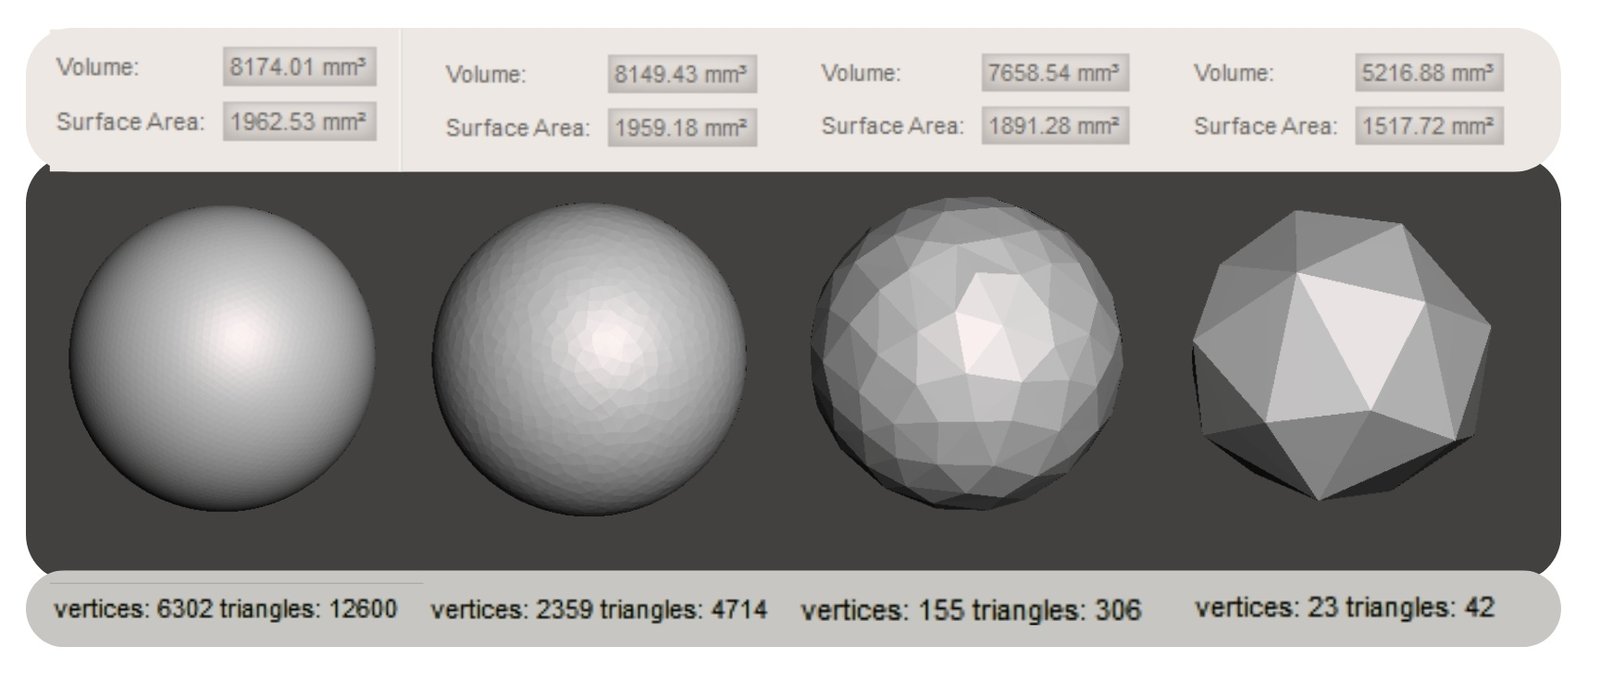
Рисунок 31
Fig.‎ 6.3-2 Difference of volumetric characteristics in figures with different number of polygons.

Polygonal MESH, as well as parametric BREP, have their own advantages and limitations, but the goal is the same – to describe the geometry taking into account the user’s tasks. Ultimately, the accuracy of a geometric model depends not only on the method of its representation, but also on the requirements of a particular task.

In most construction problems, the need for parametric geometry and complex geometric kernels may be redundant.

In each particular calculation automation task, it is worth considering whether the importance of parametric geometry is exaggerated by CAD developers who are interested in promoting and selling their own software products.

.

Leave a Reply

Change language

Post's Highlights

Stay updated: news and insights


We’re Here to Help

Fresh solutions are released through our social channels

UNLOCK THE POWER OF DATA
 IN CONSTRUCTION

Dive into the world of data-driven construction with this accessible guide, perfect for professionals and novices alike.
From the basics of data management to cutting-edge trends in digital transformation, this book
will be your comprehensive guide to using data in the construction industry.

Related posts 

Focus Areas

Search

Search
Sorry, no articles found.

✕

Don't miss the new solutions


✕
✕

Linux

macOS

Looking for the Linux or MAC version? Send us a quick message using the button below, and we’ll guide you through the process!

✕

📥 Download OnePager

Welcome to DataDrivenConstruction—where data meets innovation in the construction industry. Our One-Pager offers a concise overview of how our data-driven solutions can transform your projects, enhance efficiency, and drive sustainable growth. 

✕

🚀 Welcome to the future of data in construction!

You're taking your first step into the world of open data, working with normalized, structured data—the foundation of data analytics and modern automation tools.

By downloading, you agree to the DataDrivenConstruction terms of use 

Stay ahead with the latest updates on converters, tools, AI, LLM
and data analytics in construction — Subscribe now!

✕

🚀 Welcome to the future of data in construction!

You're taking your first step into the world of open data, working with normalized, structured data—the foundation of data analytics and modern automation tools.

By downloading, you agree to the DataDrivenConstruction terms of use 

Stay ahead with the latest updates on converters, tools, AI, LLM
and data analytics in construction — Subscribe now!

✕

🚀 Welcome to the future of data in construction!

You're taking your first step into the world of open data, working with normalized, structured data—the foundation of data analytics and modern automation tools.

By downloading, you agree to the DataDrivenConstruction terms of use 

Stay ahead with the latest updates on converters, tools, AI, LLM
and data analytics in construction — Subscribe now!

✕

🚀 Welcome to the future of data in construction!

You're taking your first step into the world of open data, working with normalized, structured data—the foundation of data analytics and modern automation tools.

By downloading, you agree to the DataDrivenConstruction terms of use 

Stay ahead with the latest updates on converters, tools, AI, LLM
and data analytics in construction — Subscribe now!

✕

🚀 Welcome to the future of data in construction!

You're taking your first step into the world of open data, working with normalized, structured data—the foundation of data analytics and modern automation tools.

By downloading, you agree to the DDC terms of use 

✕

🚀 Welcome to the future of data in construction!

You're taking your first step into the world of open data, working with normalized, structured data—the foundation of data analytics and modern automation tools.

By downloading, you agree to the DataDrivenConstruction terms of use 

Stay ahead with the latest updates on converters, tools, AI, LLM
and data analytics in construction — Subscribe now!

✕
DataDrivenConstruction offers workshops tested and practiced on global leaders in the construction industry to help your team navigate and leverage the power of data and artificial intelligence in your company's decision making.

Reserve your spot now to rethink your
approach to decision making!

✕


🚀 Welcome to the future of data in construction!

By downloading, you agree to the DataDrivenConstruction terms of use 

Stay ahead with the latest updates on converters, tools, AI, LLM
and data analytics in construction — Subscribe now!

✕
Have a question or need more information? Reach out to us directly!
Schedule a time to discuss your needs with our team.
Tailored sessions to help your team grow — let's plan together!
✕
Have you attended one of our workshops, read our book, or used our solutions? Share your thoughts with us!
Name
✕
Data Maturity Diagnostics

🧰 Data-Driven Readiness Check

This short assessment will help you identify your company's data management pain points and offer solutions to improve project efficiency. It takes only 1–2 minutes to complete and you will receive personalized recommendations tailored to your needs.

✕

Clean & Organized Data

Theoretical Chapters:

Practical Chapters:

What You'll Find on
DDC Solutions:

  • CAD/BIM to spreadsheet/database converters (Revit, AutoCAD, IFC, Microstation)
  • Ready-to-deploy n8n workflows for construction processes
  • ETL pipelines for data synchronization between systems
  • Customizable Python scripts for repetitive tasks
  • Intelligent data validation and error detection
  • Real-time dashboard connectors
  • Automated reporting systems
✕

Connect Everything

Theoretical Chapters:

Practical Chapters:

What You'll Find on
DDC Solutions:

  • CAD/BIM to spreadsheet/database converters (Revit, AutoCAD, IFC, Microstation)
  • Ready-to-deploy n8n workflows for construction processes
  • ETL pipelines for data synchronization between systems
  • Customizable Python scripts for repetitive tasks
  • Intelligent data validation and error detection
  • Real-time dashboard connectors
  • Automated reporting systems
✕

Add AI & LLM Brain

Theoretical Chapters:

Practical Chapters:

What You'll Find on
DDC Solutions:

  • CAD/BIM to spreadsheet/database converters (Revit, AutoCAD, IFC, Microstation)
  • Ready-to-deploy n8n workflows for construction processes
  • ETL pipelines for data synchronization between systems
  • Customizable Python scripts for repetitive tasks
  • Intelligent data validation and error detection
  • Real-time dashboard connectors
  • Automated reporting systems
104 From lines to volumes How area and volume become data
This website uses cookies to improve your experience. By using this website you agree to our Data Protection Policy.
Read more
×