image31
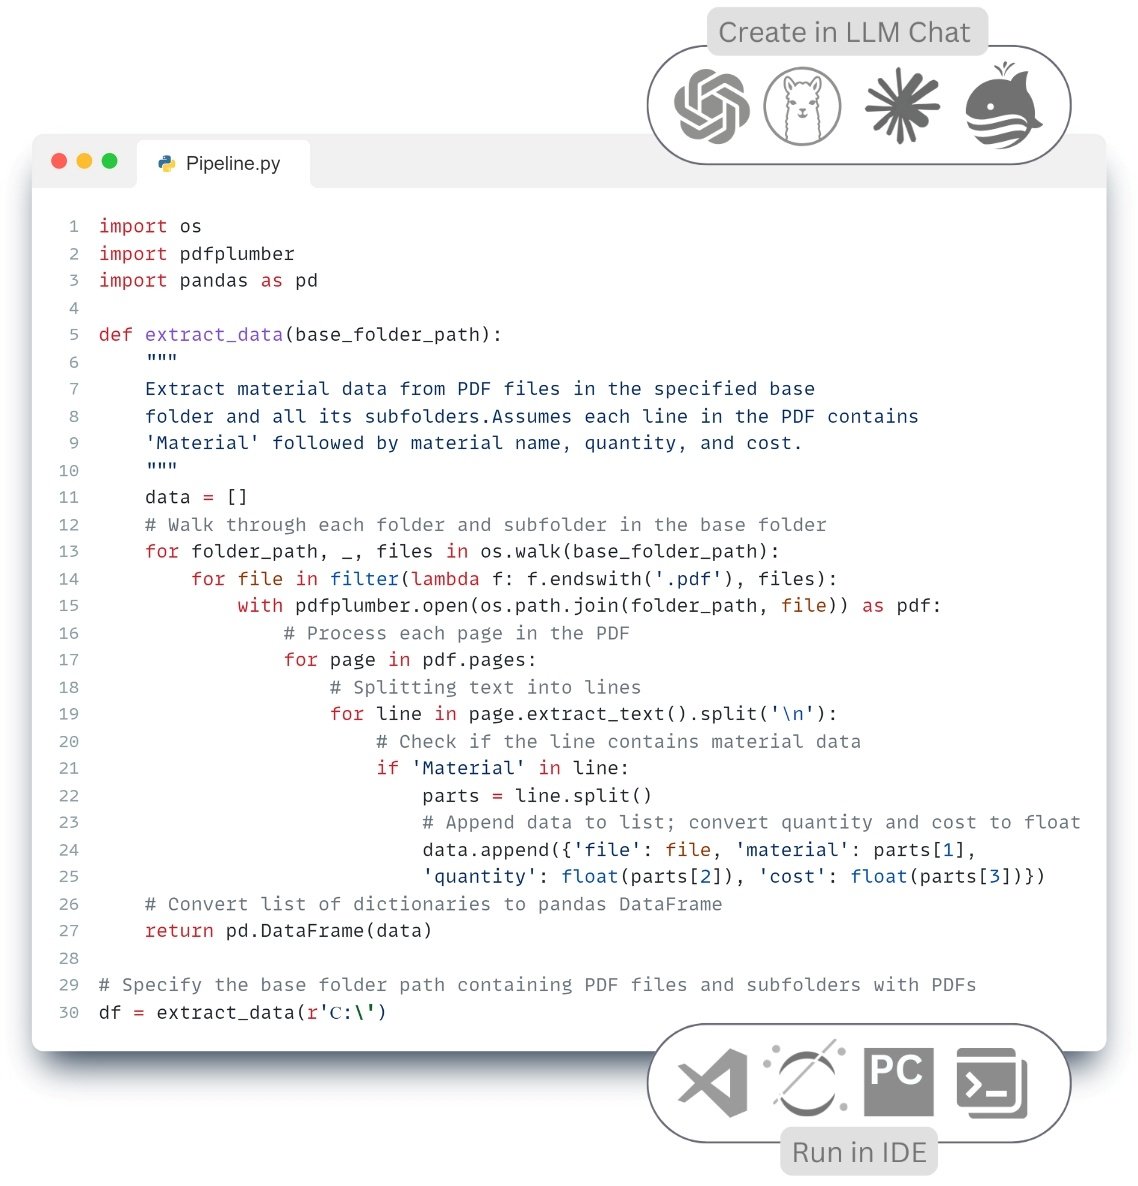
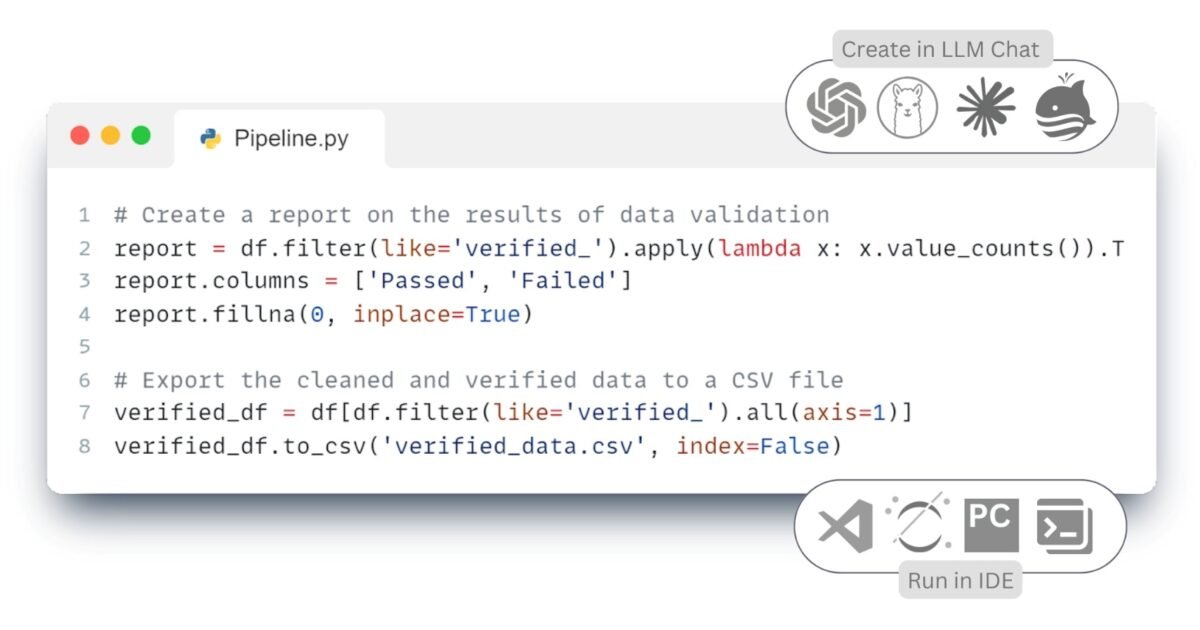
120 ETL Transform application of validation and transformation rules
9 April 2025
Picture 21
122 ETL Load Automatic creation of PDF documents
11 April 2025

121 ETL Load Visualize results in charts and graphs

After completion of the Transform stage, when the data have been brought to a structured form and verified, the final stage – Load, where the data can be both loaded into target system and visualized for analysis. Visual presentation of data allows to promptly identify deviations, analyze distributions and communicate key conclusions to all project participants, including those with no technical background.

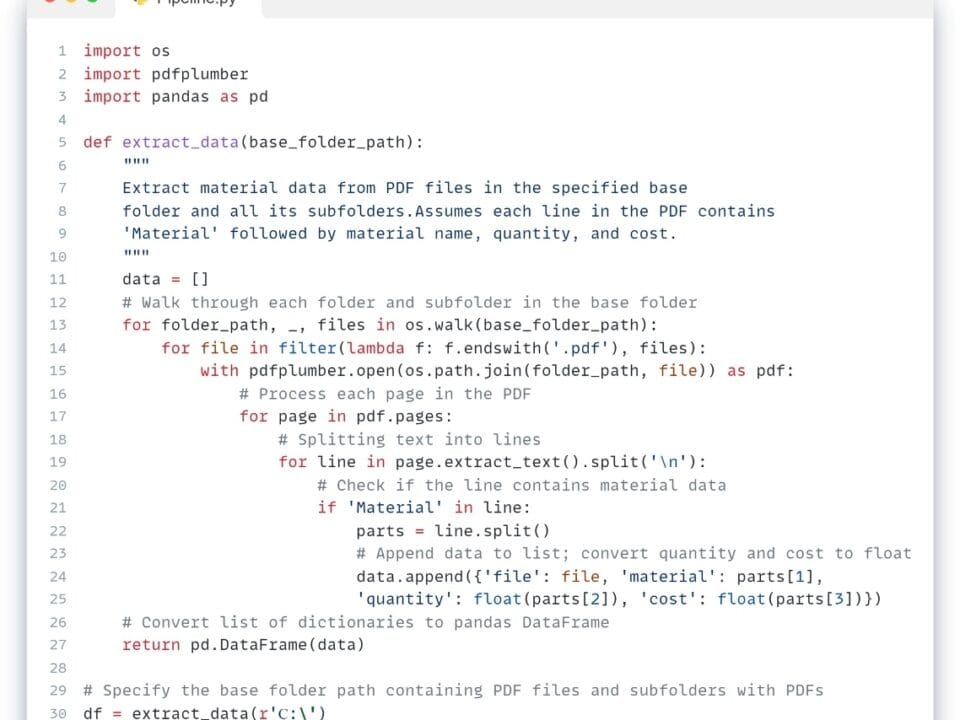
Instead of presenting information as tables and numbers, we can use infographics, graphs, and dashboards (dashboards). One of the most common and flexible tools for visualizing structured data in Python is the Matplotlib library (Fig. 7.2-9, Fig. 7.2-10). It allows you to create static, animated, and interactive graphs, and supports a wide range of chart types.

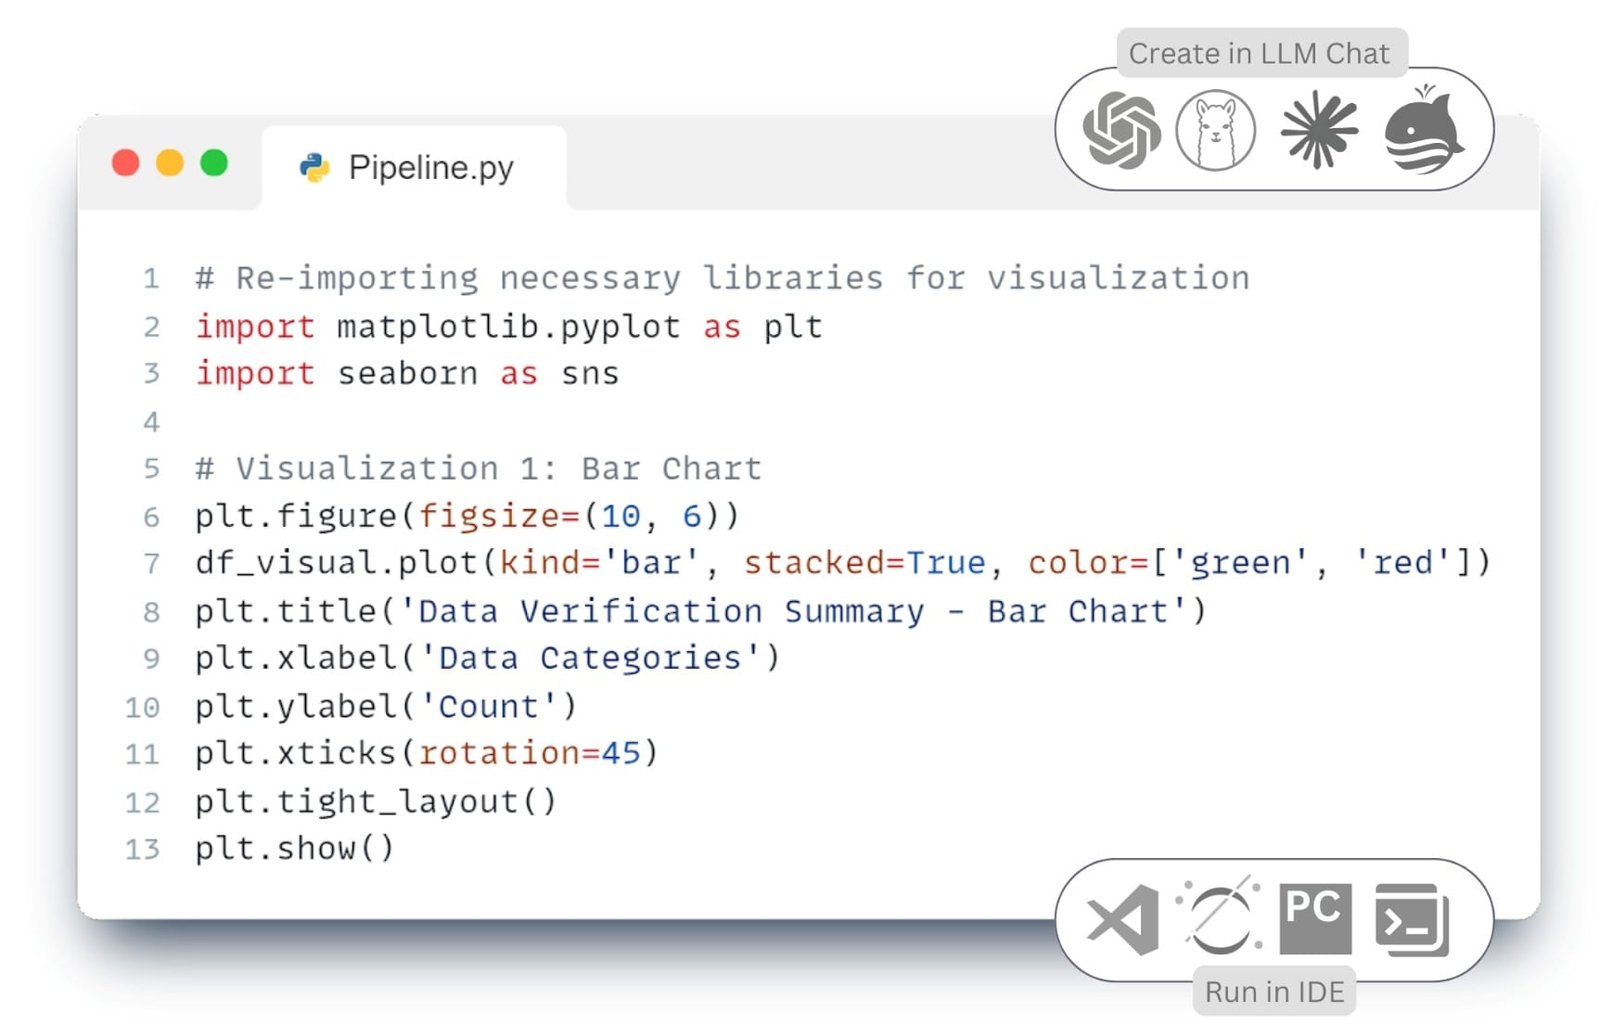
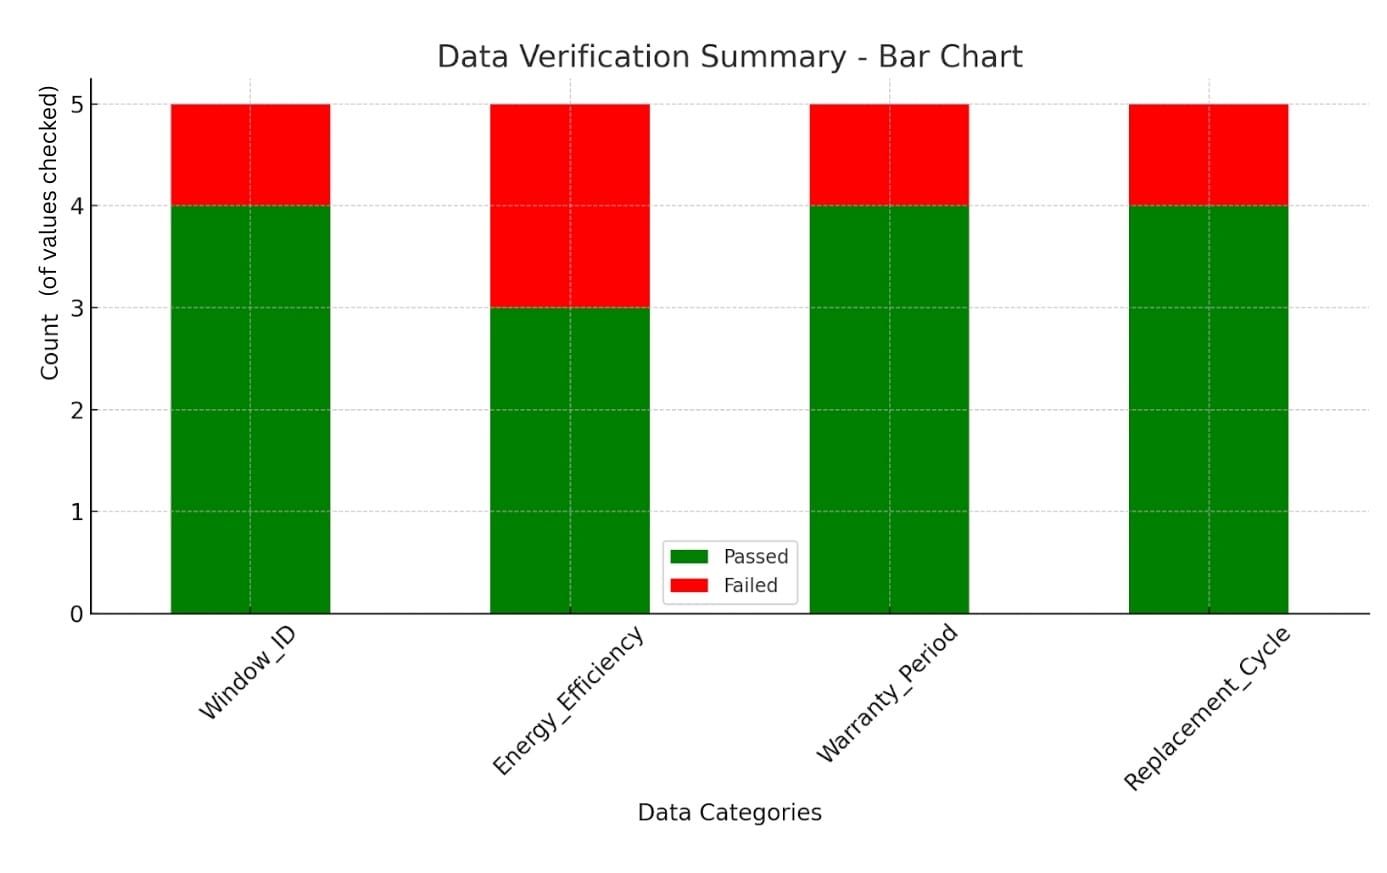
  • To visualize the results of attribute checking from the RPM system (Fig. 7.2-7), you can use the following query to the language model:

    Write code to visualize the DataFrame data, above (Fig. 7.2-7), with a histogram for the results to show the error rate of the attribute ⏎
.

.

.

.

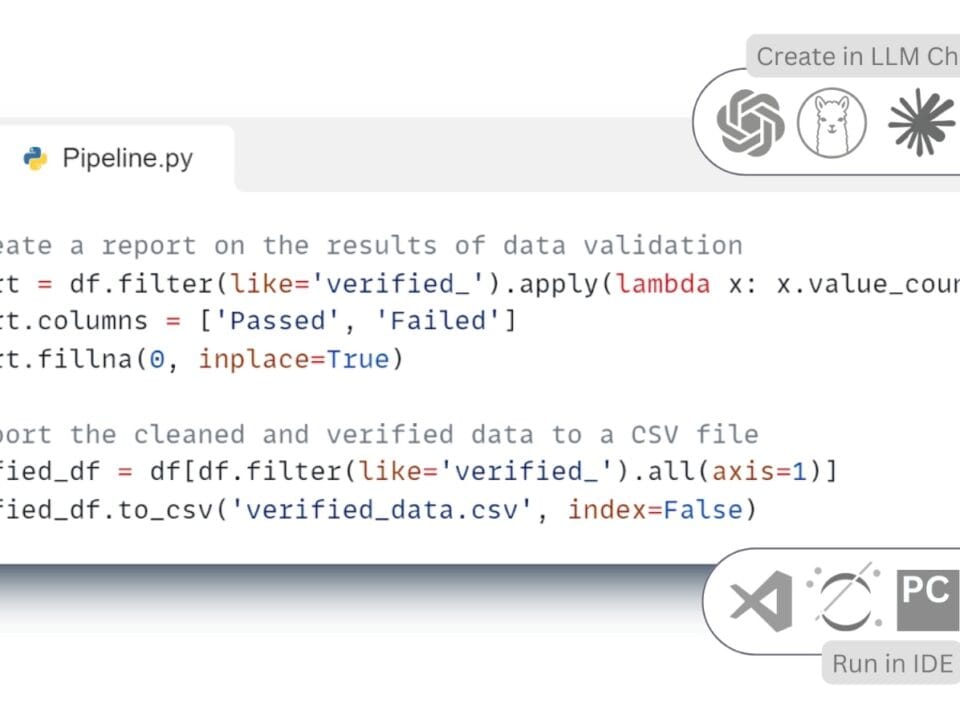
  • LLM response in code form and ready visualization directly in the LLM chat room of the code execution results:

Picture 15

Picture 16
Fig. 7.2-9 Visualization of the results of the Transform step of checking attribute values from the RPM system (Fig. 7.2-7) as a histogram in the Load step.
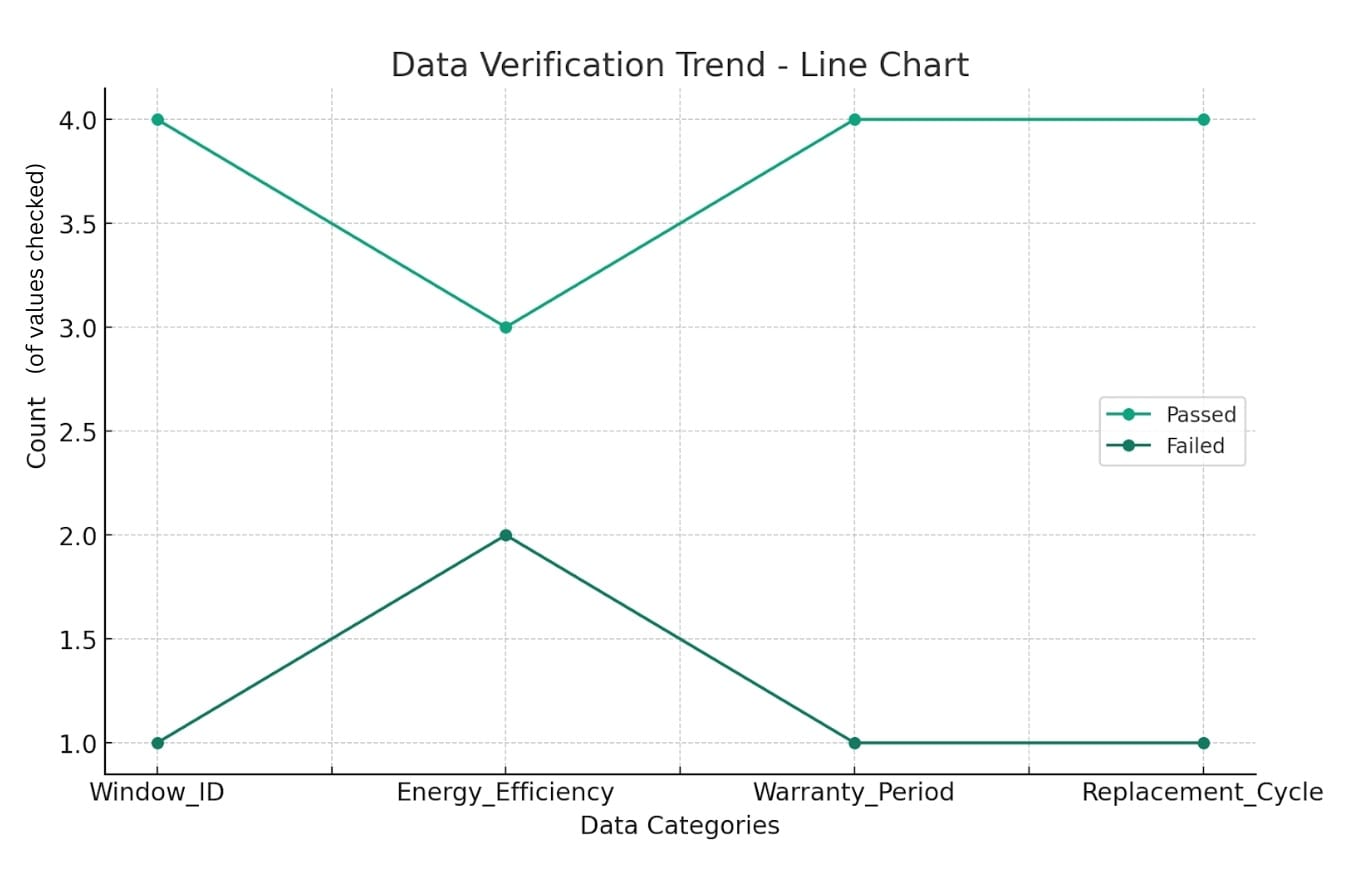
  • There are many open source and free visualization libraries that allow you to represent structured data in various formats. Let’s continue visualizing the results with another type of graph with the following prompt in the chat:

    Depict the same data as a graph of lines ⏎
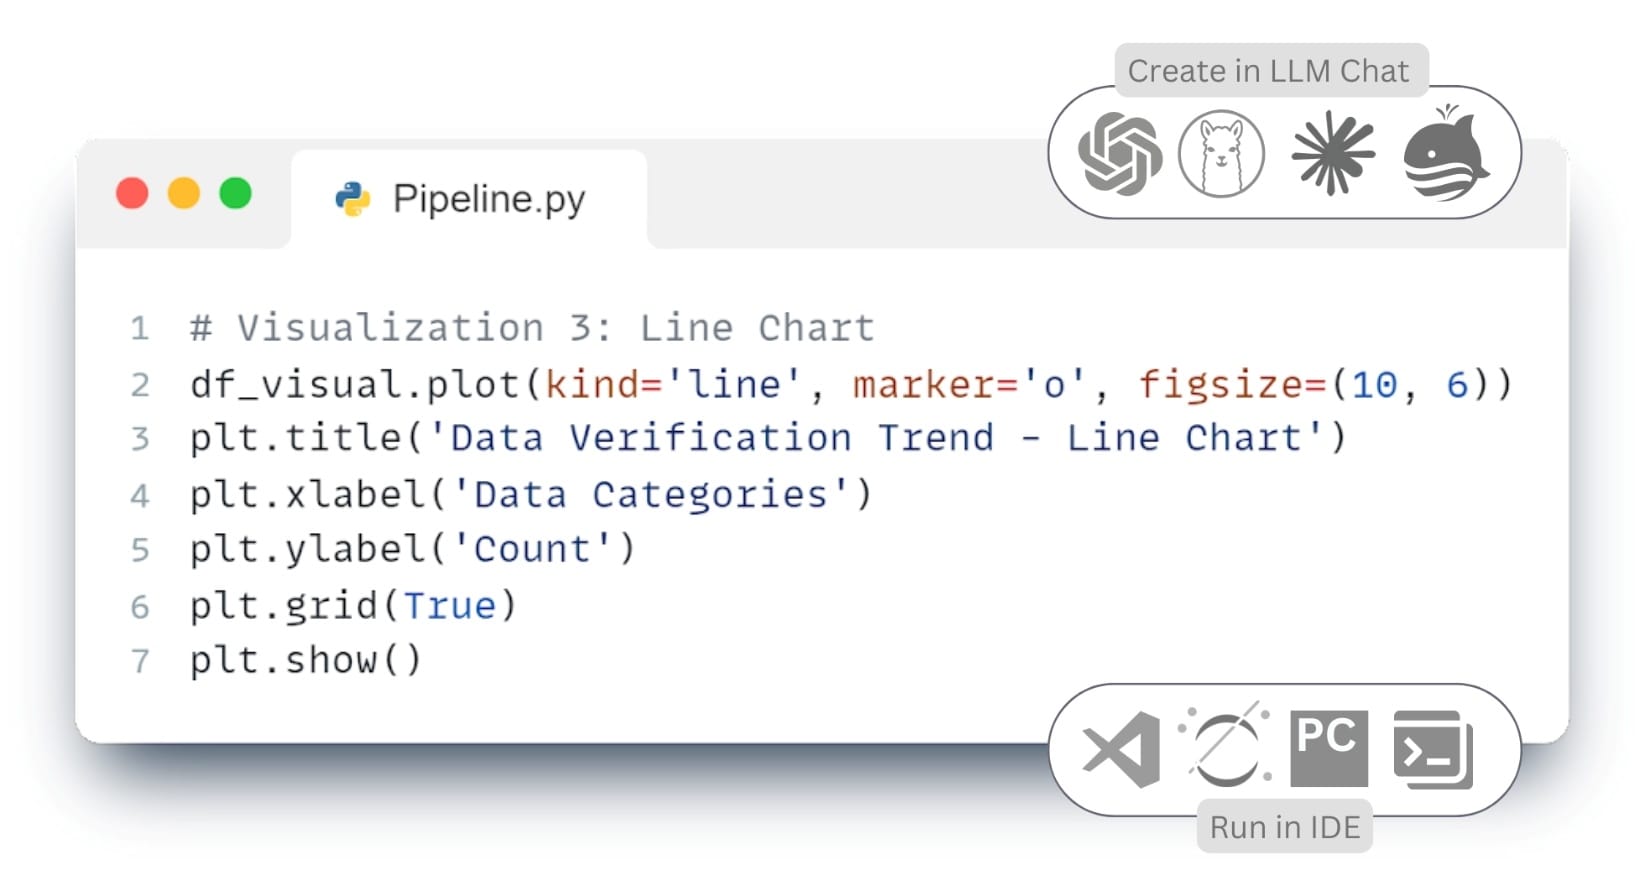
  • LLM’s response:
Picture 17Picture 18
Fig.‎ 7.2-10 Visualization of the validation data (Fig.‎ 7.2-8) as a line diagram obtained using the Matplotlib library.

.

There are many open source and free visualization libraries such as:

  • Seaborn – for statistical graphs (Fig.‎ 7.2-11)
  • Plotly – for interactive web visualizations (Fig.‎ 7.2-12, Fig.‎ 7.1-6)
  • Altair – for declarative visualization
  • Dash or Streamlit – to create full dashboards

Knowledge of specific libraries for visualization is not necessary – modern tools, including LLM, allow you to automatically generate code for graphs and entire applications based on the task description.

The choice of tool depends on the objectives of the project: whether it is a report, a presentation or an online dashboard. For example, the open source library Seaborn is particularly good for working with categorical data, helping to identify patterns and trends.

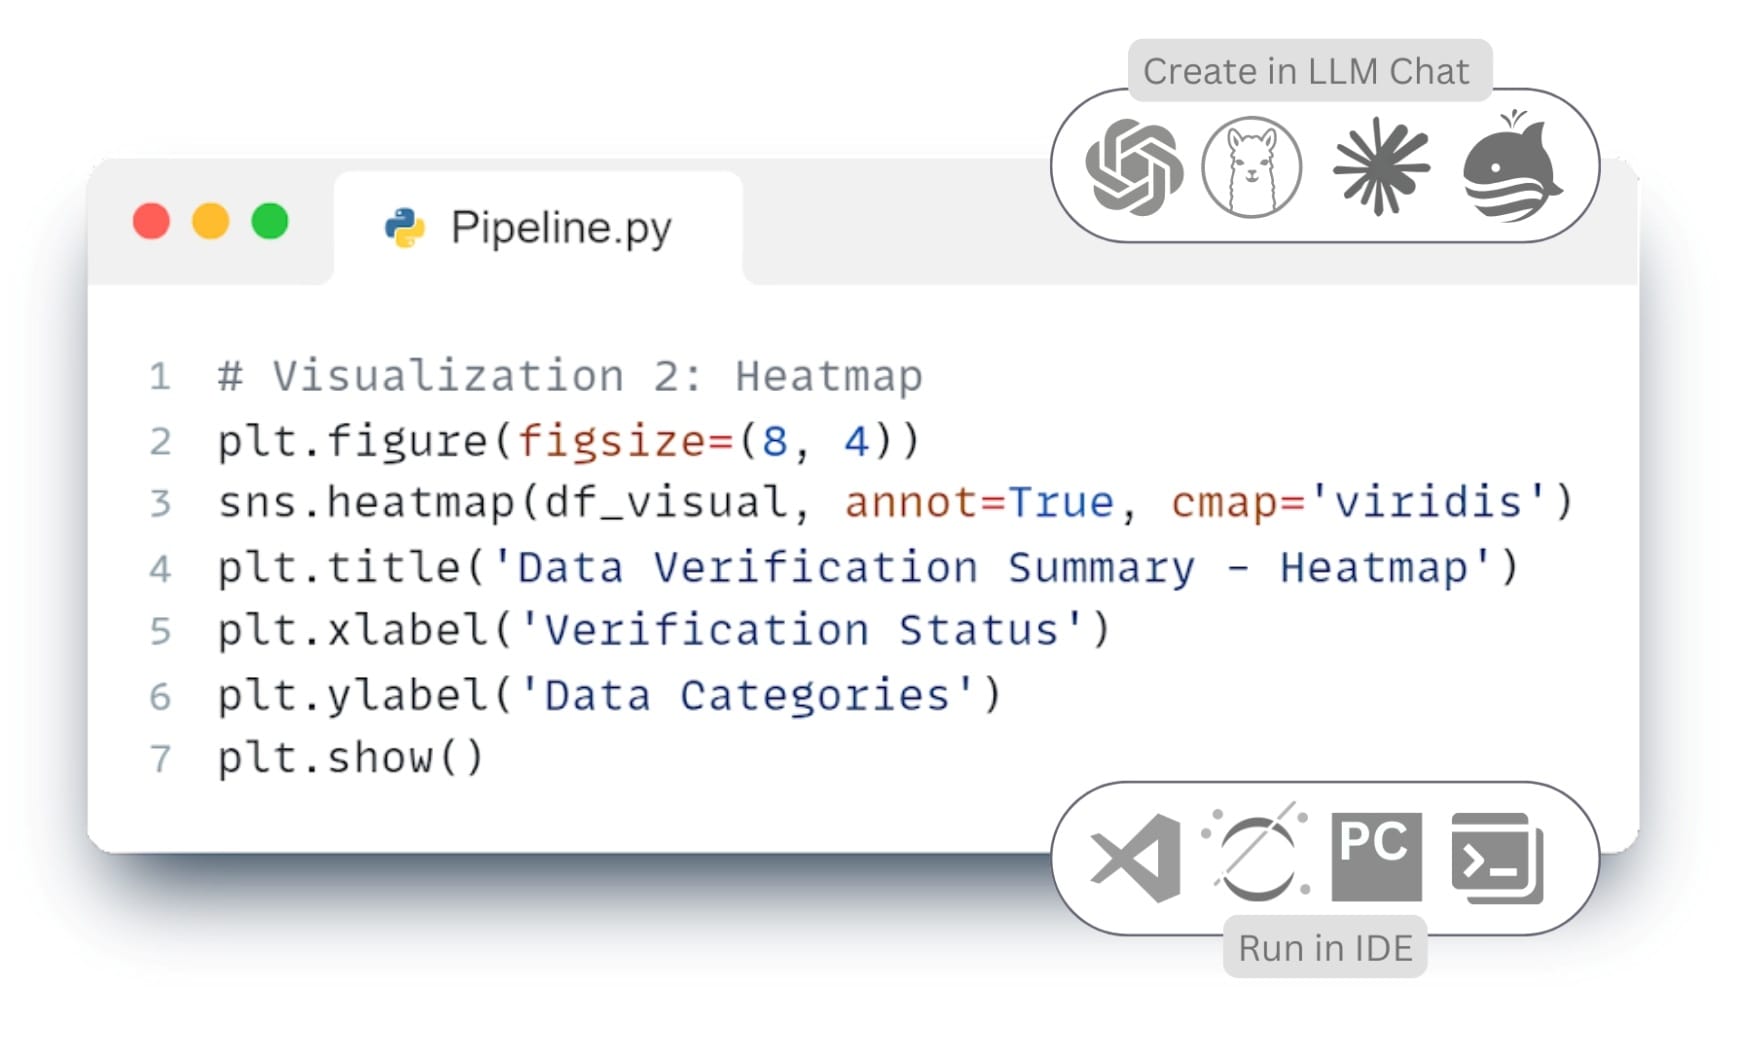
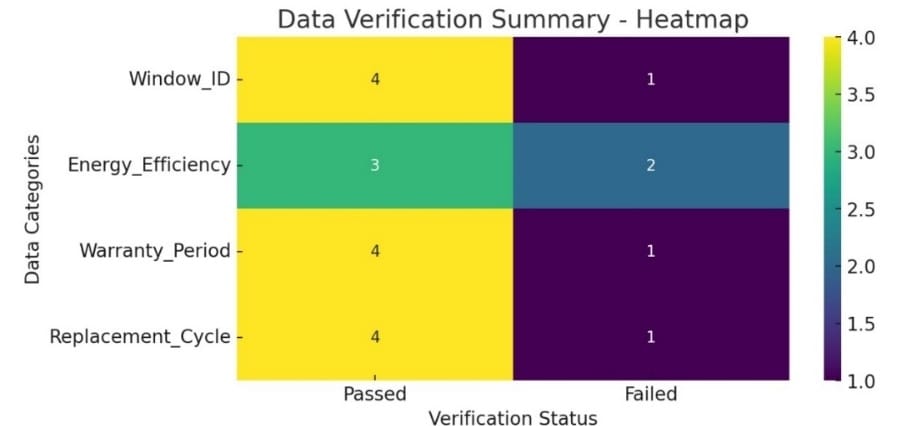
  • To see the Seaborn library in operation, you can either ask the LLM to use the desired library directly or submit a similar text request in the LLM continuation at:

    Show heatmap for ⏎

  • LLM’s answer in the form of code and a finished graph, the plotting code of which can now be copied into the IDE, and the graph itself can be copied or saved for insertion into a document:
Picture 19

Picture 20
Fig. 7.2-11 Visualizing the results of validating (Fig. 7.2-8) the data using the Seaborn library.

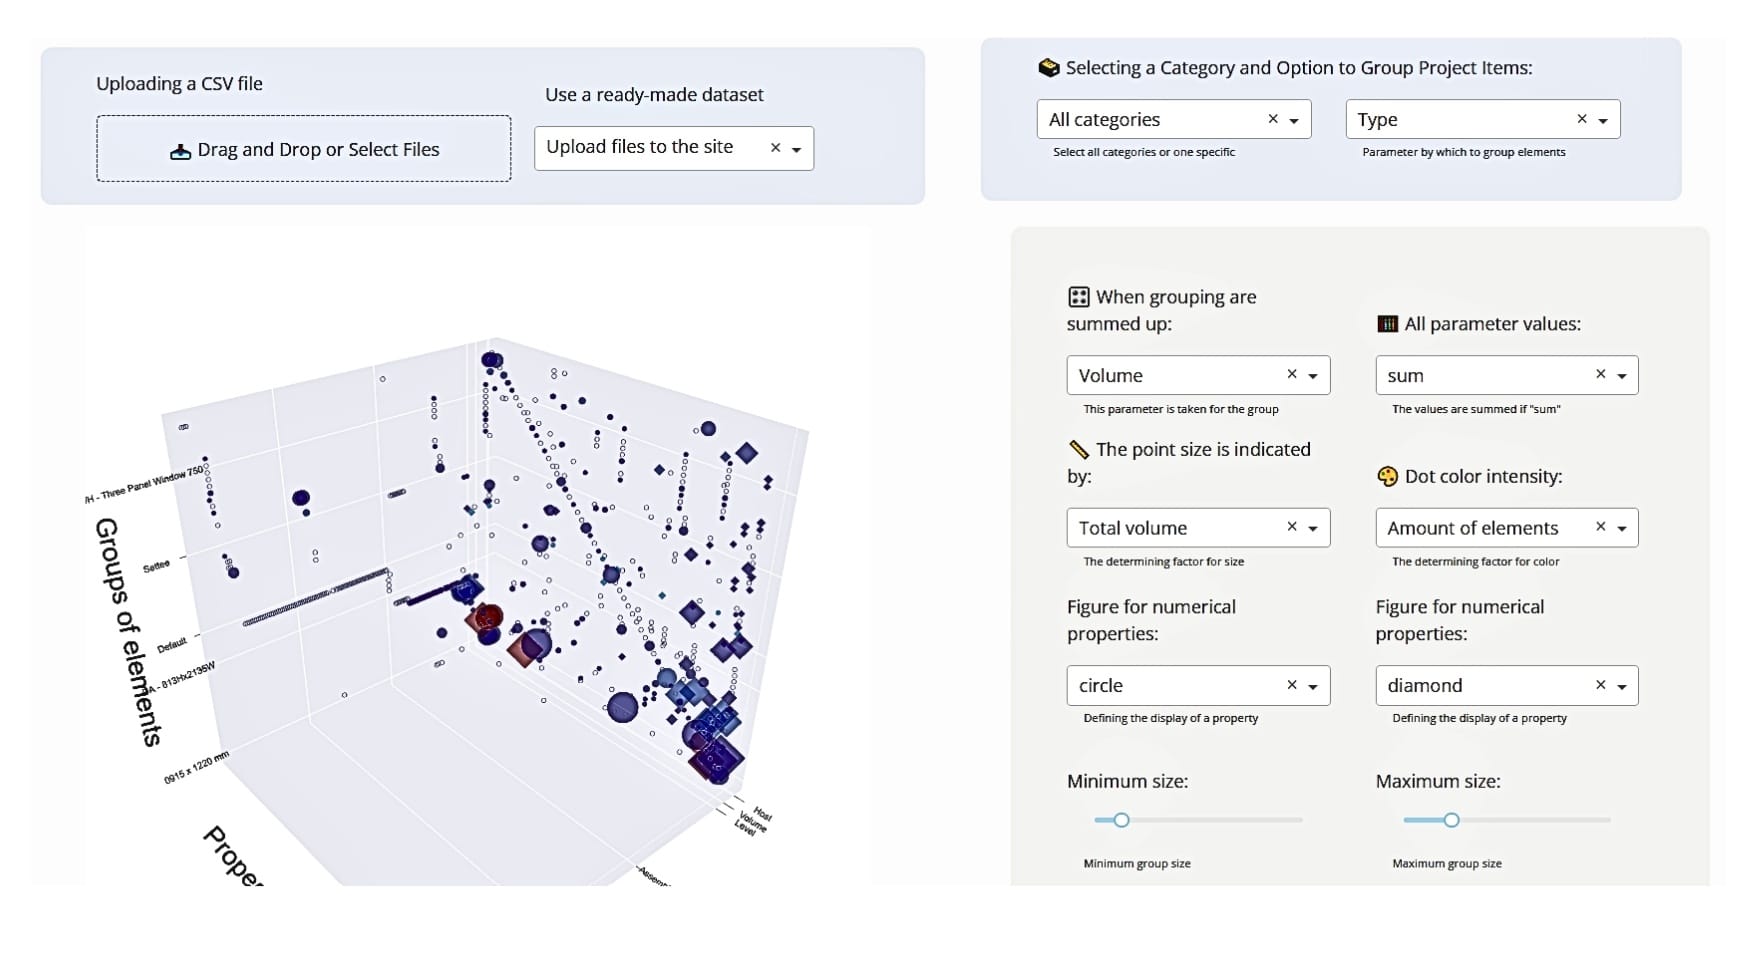
For those who prefer an interactive approach, there are tools that allow you to create dynamic charts and panels with the ability to interact. The Plotly library (Fig. 7.1-6, Fig. 7.2-12) offers the ability to create highly interactive charts and panels that can be embedded in web pages and allow the user to interact with the data in real time.
Picture 13
Fig.‎ 7.2-12 Interactive 3D -visualization of element attributes from a CAD- (BIM-) project using the Plotly library.

Specialized open source libraries Bokeh, Dash and Streamlit provide a convenient way to present data without requiring deep knowledge of web development. Bokeh is suitable for complex interactive graphs, Dash is used to build full-fledged analytical dashboards, and Streamlit allows you to quickly create web applications for data analysis.

With visualization tools like these, developers and analysts can effectively disseminate results to colleagues and stakeholders, enabling intuitive interaction with data and simplifying decision-making.

.

Leave a Reply

Change language

Post's Highlights

Stay updated: news and insights


We’re Here to Help

Fresh solutions are released through our social channels

UNLOCK THE POWER OF DATA
 IN CONSTRUCTION

Dive into the world of data-driven construction with this accessible guide, perfect for professionals and novices alike.
From the basics of data management to cutting-edge trends in digital transformation, this book
will be your comprehensive guide to using data in the construction industry.

Related posts 

Focus Areas

Search

Search
Sorry, no articles found.

✕

Don't miss the new solutions


✕
✕

Linux

macOS

Looking for the Linux or MAC version? Send us a quick message using the button below, and we’ll guide you through the process!

✕

📥 Download OnePager

Welcome to DataDrivenConstruction—where data meets innovation in the construction industry. Our One-Pager offers a concise overview of how our data-driven solutions can transform your projects, enhance efficiency, and drive sustainable growth. 

✕

🚀 Welcome to the future of data in construction!

You're taking your first step into the world of open data, working with normalized, structured data—the foundation of data analytics and modern automation tools.

By downloading, you agree to the DataDrivenConstruction terms of use 

Stay ahead with the latest updates on converters, tools, AI, LLM
and data analytics in construction — Subscribe now!

✕

🚀 Welcome to the future of data in construction!

You're taking your first step into the world of open data, working with normalized, structured data—the foundation of data analytics and modern automation tools.

By downloading, you agree to the DataDrivenConstruction terms of use 

Stay ahead with the latest updates on converters, tools, AI, LLM
and data analytics in construction — Subscribe now!

✕

🚀 Welcome to the future of data in construction!

You're taking your first step into the world of open data, working with normalized, structured data—the foundation of data analytics and modern automation tools.

By downloading, you agree to the DataDrivenConstruction terms of use 

Stay ahead with the latest updates on converters, tools, AI, LLM
and data analytics in construction — Subscribe now!

✕

🚀 Welcome to the future of data in construction!

You're taking your first step into the world of open data, working with normalized, structured data—the foundation of data analytics and modern automation tools.

By downloading, you agree to the DataDrivenConstruction terms of use 

Stay ahead with the latest updates on converters, tools, AI, LLM
and data analytics in construction — Subscribe now!

✕

🚀 Welcome to the future of data in construction!

You're taking your first step into the world of open data, working with normalized, structured data—the foundation of data analytics and modern automation tools.

By downloading, you agree to the DDC terms of use 

✕

🚀 Welcome to the future of data in construction!

You're taking your first step into the world of open data, working with normalized, structured data—the foundation of data analytics and modern automation tools.

By downloading, you agree to the DataDrivenConstruction terms of use 

Stay ahead with the latest updates on converters, tools, AI, LLM
and data analytics in construction — Subscribe now!

✕
DataDrivenConstruction offers workshops tested and practiced on global leaders in the construction industry to help your team navigate and leverage the power of data and artificial intelligence in your company's decision making.

Reserve your spot now to rethink your
approach to decision making!

✕


🚀 Welcome to the future of data in construction!

By downloading, you agree to the DataDrivenConstruction terms of use 

Stay ahead with the latest updates on converters, tools, AI, LLM
and data analytics in construction — Subscribe now!

✕
Have a question or need more information? Reach out to us directly!
Schedule a time to discuss your needs with our team.
Tailored sessions to help your team grow — let's plan together!
✕
Have you attended one of our workshops, read our book, or used our solutions? Share your thoughts with us!
Name
✕
Data Maturity Diagnostics

🧰 Data-Driven Readiness Check

This short assessment will help you identify your company's data management pain points and offer solutions to improve project efficiency. It takes only 1–2 minutes to complete and you will receive personalized recommendations tailored to your needs.

✕

Clean & Organized Data

Theoretical Chapters:

Practical Chapters:

What You'll Find on
DDC Solutions:

  • CAD/BIM to spreadsheet/database converters (Revit, AutoCAD, IFC, Microstation)
  • Ready-to-deploy n8n workflows for construction processes
  • ETL pipelines for data synchronization between systems
  • Customizable Python scripts for repetitive tasks
  • Intelligent data validation and error detection
  • Real-time dashboard connectors
  • Automated reporting systems
✕

Connect Everything

Theoretical Chapters:

Practical Chapters:

What You'll Find on
DDC Solutions:

  • CAD/BIM to spreadsheet/database converters (Revit, AutoCAD, IFC, Microstation)
  • Ready-to-deploy n8n workflows for construction processes
  • ETL pipelines for data synchronization between systems
  • Customizable Python scripts for repetitive tasks
  • Intelligent data validation and error detection
  • Real-time dashboard connectors
  • Automated reporting systems
✕

Add AI & LLM Brain

Theoretical Chapters:

Practical Chapters:

What You'll Find on
DDC Solutions:

  • CAD/BIM to spreadsheet/database converters (Revit, AutoCAD, IFC, Microstation)
  • Ready-to-deploy n8n workflows for construction processes
  • ETL pipelines for data synchronization between systems
  • Customizable Python scripts for repetitive tasks
  • Intelligent data validation and error detection
  • Real-time dashboard connectors
  • Automated reporting systems
121 ETL Load Visualize results in charts and graphs
This website uses cookies to improve your experience. By using this website you agree to our Data Protection Policy.
Read more
×