Picture 8
148 Big data analyzing data from San Francisco’s million building permit dataset
11 May 2025
Picture 9
150 IoT Internet of Things and Smart Contracts
12 May 2025

149 Example of big data based on CAD data (BIM)

In the following example we will analyze a large dataset using data from different CAD tools (BIM). To collect and create the large dataset, a specialized automated web crawler (script) was used, configured to automatically search and collect design files from websites offering free architectural models in the formats RVT and IFC. In a few days, the crawler successfully found and downloaded 4,596 IFC files and 6,471 RVT files and 156,024 DWG files (А. Boiko, “Kaggle: RVT IFC Files 5000 Projects,” 2024).

After collecting projects in RVT and IFC formats of different versions and converting them to a structured CSV format using the free reverse engineering SDKs, nearly 10 thousand RVT and IFC projects were collected into one large Apache Parquet table file and uploaded to Pandas DataFrame for analysis (Fig. 9.1-9).
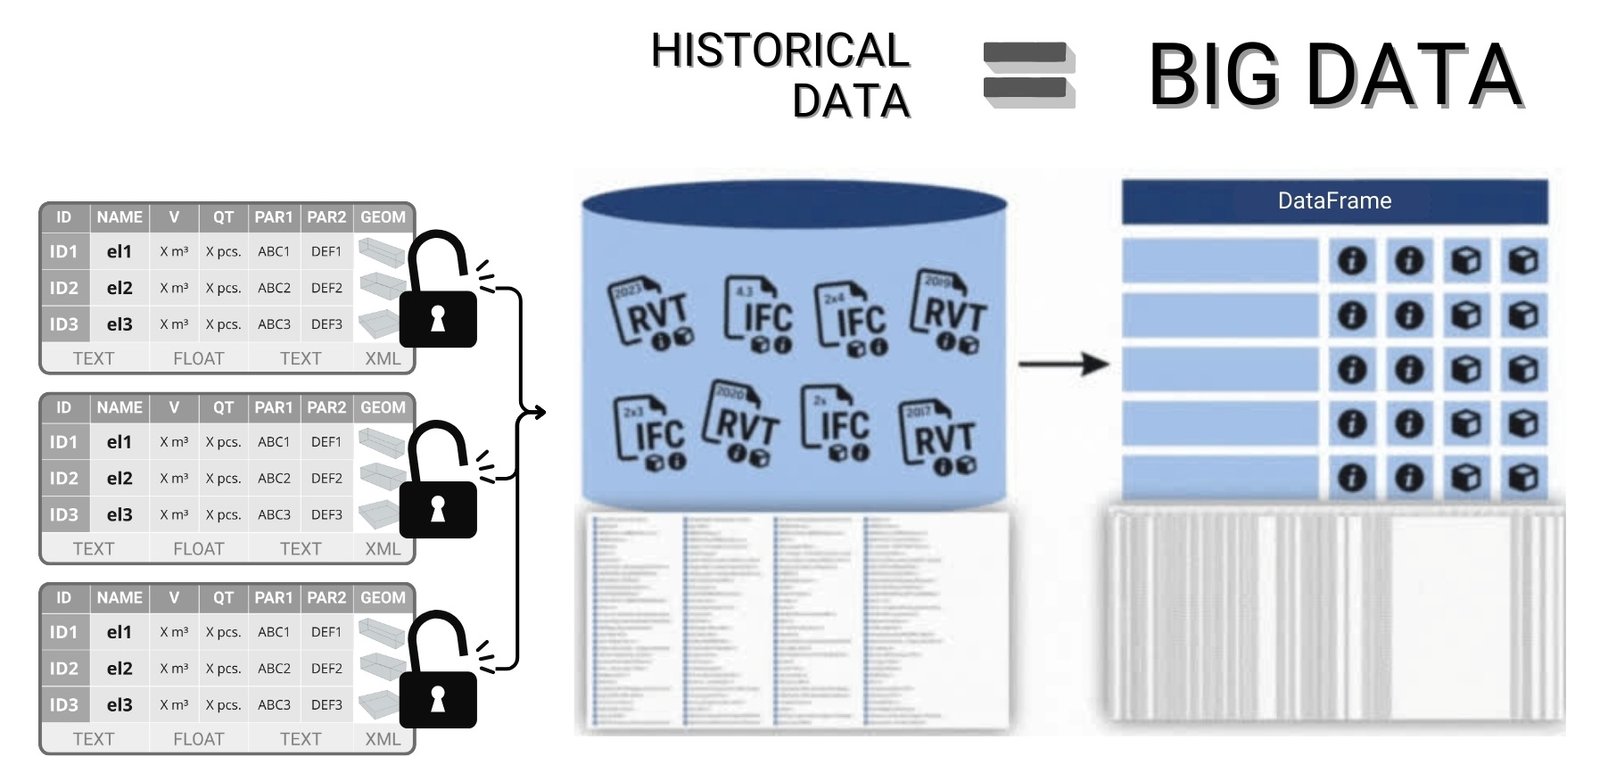
image73
Fig. 9.1-9 Structured Data project data allows you to combine any number of projects into a single two-dimensional table.

The data from this large-scale collection contains the following information: the IFC file set contains about 4 million entities (rows) and 24,962 attributes (columns), and the RVT file set, consisting of about 6 million entities (rows), contains 27,025 different attributes (columns).

These information sets (Fig. 9.1-10) cover millions of elements, for each of which the coordinates of the Bounding Box geometry (the rectangle that defines the boundaries of the object in the project) were additionally obtained and added to a common table – the coordinates of the Bounding Box geometry (the rectangle that defines the boundaries of the object in the project) and images of each element in PNG format and the geometry in the open XML format – DAE (Collada) were created.
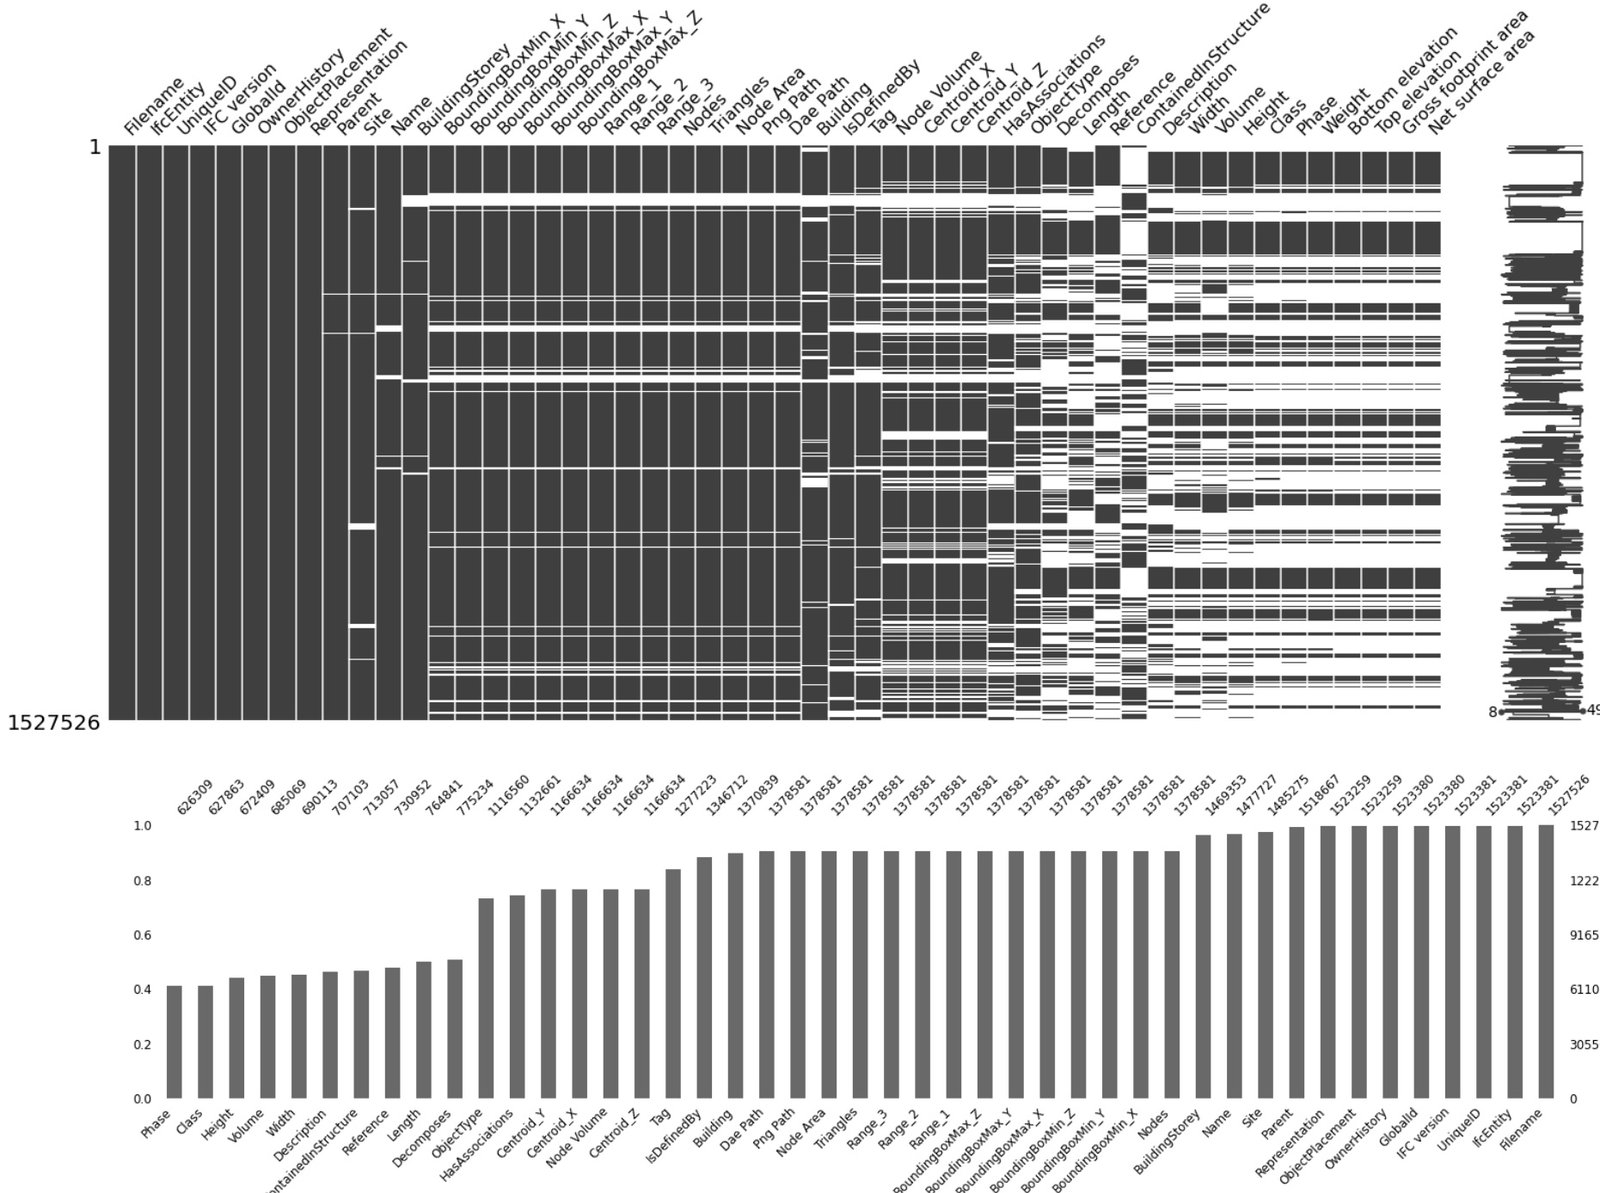
image41
Fig.‎ 9.1-10 Subset of 1.5 million elements and visualization (missingno library) of the occupancy of the first 100 attributes as a histogram.

Thus, we obtained all information about tens of millions of elements from 4,596 IFC projects and 6,471 RVT projects, where all attributes-properties of all entity elements and their geometry (Bounding Box) were translated into a structured form of a single table (DataFrame) (Fig.‎ 9.1-10 – data about dataframe populations appear as histograms).

Histograms (Fig.‎ 9.1-10, Fig.‎ 9.2-6, Fig.‎ 9.2-7) plotted during the analysis process allow a quick assessment of the data density and frequency of occurrence of values in columns. This gives a first insight into the distribution of features, the presence of outliers and the potential usefulness of individual attributes in analyzing and building machine learning models.

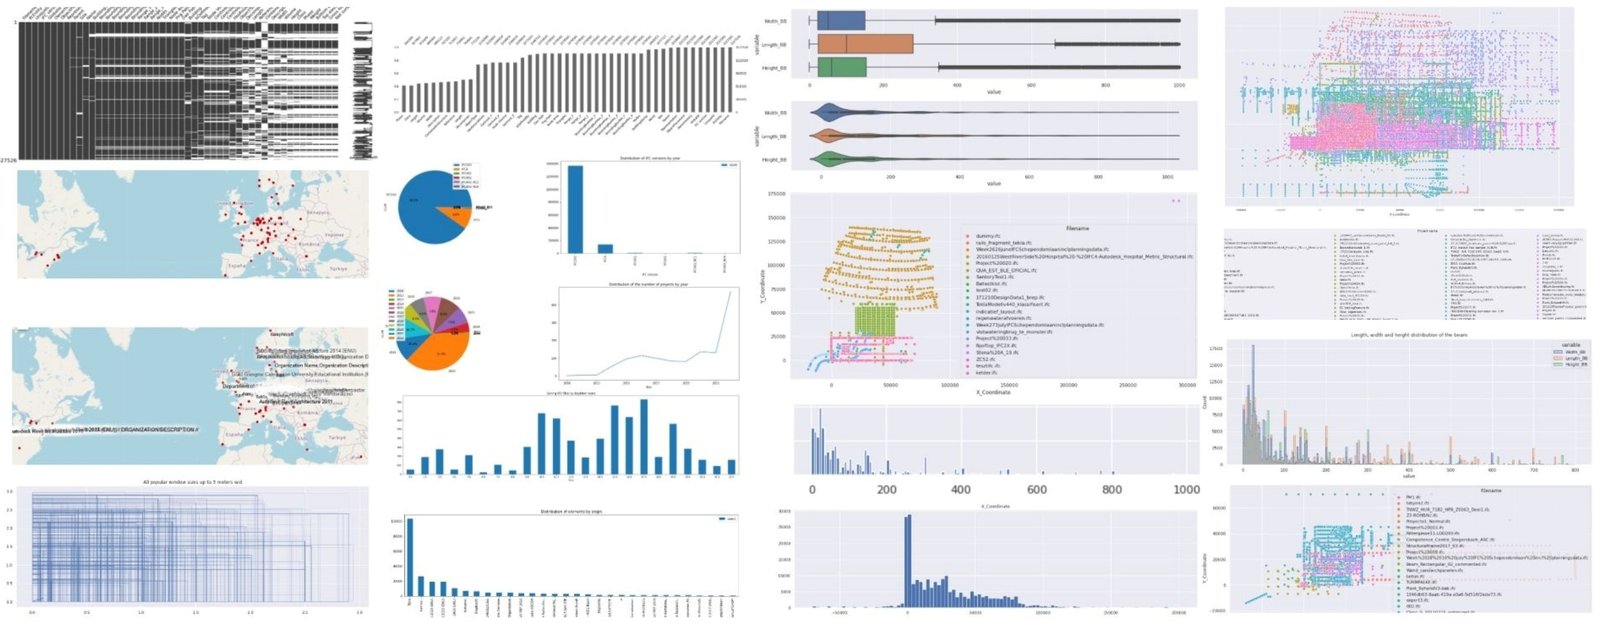
One example of a practical use of this dataset (Fig.‎ 9.1-10) is the “5000 IFC and RVT” project.(А. Boiko, “Kaggle: RVT IFC Files 5000 Projects,” 2024), available on the Kaggle platform. It presents Jupyter Notebook with full Pipeline solution: from preprocessing and data analysis to visualization of results using Python libraries – pandas, matplotlib, seaborn, folium and others (Fig.‎ 9.1-11).

image97
Fig. 9.1-11 Examples of analyzing data from CAD formats (BIM) using Python visualization libraries and the pandas library.

Based on meta-information, it is possible to determine in which cities certain projects have been developed and display this on a map (e.g., using the folium library). In addition, time stamps in the data allow you to explore patterns in the time when files were saved or edited: by day of the week, time of day, and month.
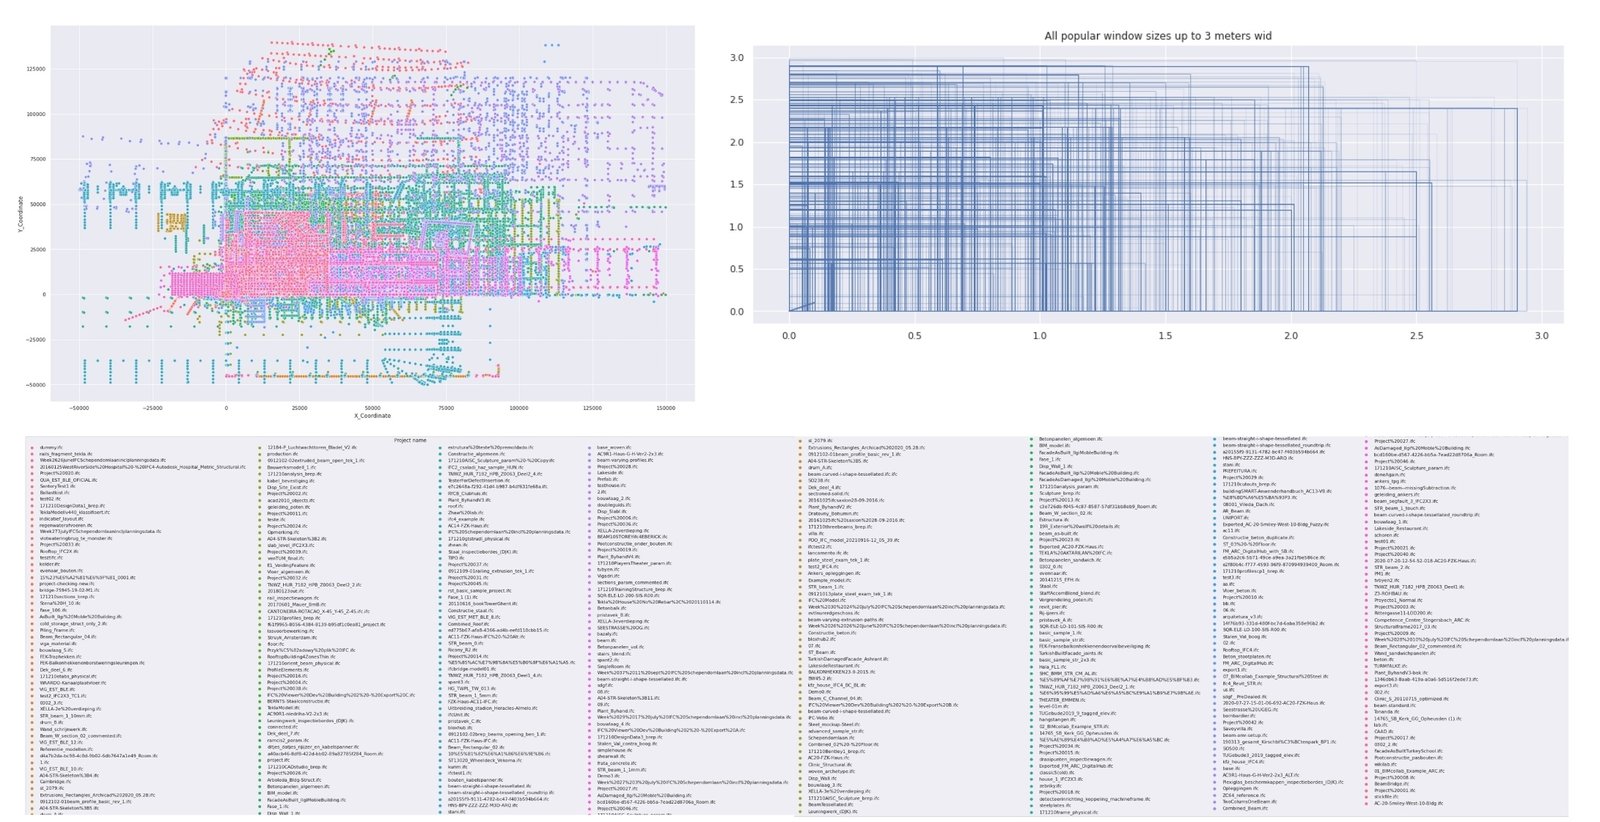
image2
Fig. 9.1-12 Visualization of the geometric position of all columns and the dimensions of all windows up to 3 meters in projects from the list at the bottom of the chart.

Geometric parameters in the form of Bounding Box extracted from the models also lend themselves to aggregate analysis. For example, Fig. 9.1-12 shows two graphs: the left one shows the distribution of distances between columns for all projects relative to the zero point, and the right one shows the sizes of all windows up to 3 meters high in a sample of tens of thousands of window elements (after grouping the whole dataset by the parameter “Category” with the value “OST_Windows”, “IfcWindows”).

The analytical Pipeline code for this example and the dataset itself are available on the Kaggle website under the title “5000 IFC and RVT| DataDrivenCo-nstruction.io projects” (А. Boiko, “Kaggle: RVT IFC Files 5000 Projects,” 2024). This finished Pipeline along with the dataset can be copied and runfree online for free on Kaggle or offline in one of the popular IDEs: PyCharm, Visual Studio Code (VS Code), Jupyter Notebook, Spyder, Atom, Sublime Text, Eclipse with PyDev plugin, Thonny, Wing IDE, IntelliJ IDEA with Python plugin, JupyterLab or popular online tools Kaggle.com, Google Collab, Microsoft Azure Notebooks, Amazon SageMaker.

Analytical data derived from the processing and examination of huge amounts of structured data will play a crucial role in decision-making processes in the construction industry.

With this kind of information analysis based on past project data, experts can effectively forecast, for example, material and labor requirements and optimize design solutions before construction begins

However, while design data or building permits are relatively static information that changes relatively slowly, the construction process itself is rapidly becoming saturated with a variety of sensors and IoT -devices: cameras, automated monitoring systems that transmit data in real time – all of this turns the construction site into a dynamic digital environment where data needs to be analyzed in real time.

.

Leave a Reply

Change language

Post's Highlights

Stay updated: news and insights


We’re Here to Help

Fresh solutions are released through our social channels

UNLOCK THE POWER OF DATA
 IN CONSTRUCTION

Dive into the world of data-driven construction with this accessible guide, perfect for professionals and novices alike.
From the basics of data management to cutting-edge trends in digital transformation, this book
will be your comprehensive guide to using data in the construction industry.

Related posts 

Focus Areas

Search

Search
Sorry, no articles found.

✕

Don't miss the new solutions


✕
✕

Linux

macOS

Looking for the Linux or MAC version? Send us a quick message using the button below, and we’ll guide you through the process!

✕

📥 Download OnePager

Welcome to DataDrivenConstruction—where data meets innovation in the construction industry. Our One-Pager offers a concise overview of how our data-driven solutions can transform your projects, enhance efficiency, and drive sustainable growth. 

✕

🚀 Welcome to the future of data in construction!

You're taking your first step into the world of open data, working with normalized, structured data—the foundation of data analytics and modern automation tools.

By downloading, you agree to the DataDrivenConstruction terms of use 

Stay ahead with the latest updates on converters, tools, AI, LLM
and data analytics in construction — Subscribe now!

✕

🚀 Welcome to the future of data in construction!

You're taking your first step into the world of open data, working with normalized, structured data—the foundation of data analytics and modern automation tools.

By downloading, you agree to the DataDrivenConstruction terms of use 

Stay ahead with the latest updates on converters, tools, AI, LLM
and data analytics in construction — Subscribe now!

✕

🚀 Welcome to the future of data in construction!

You're taking your first step into the world of open data, working with normalized, structured data—the foundation of data analytics and modern automation tools.

By downloading, you agree to the DataDrivenConstruction terms of use 

Stay ahead with the latest updates on converters, tools, AI, LLM
and data analytics in construction — Subscribe now!

✕

🚀 Welcome to the future of data in construction!

You're taking your first step into the world of open data, working with normalized, structured data—the foundation of data analytics and modern automation tools.

By downloading, you agree to the DataDrivenConstruction terms of use 

Stay ahead with the latest updates on converters, tools, AI, LLM
and data analytics in construction — Subscribe now!

✕

🚀 Welcome to the future of data in construction!

You're taking your first step into the world of open data, working with normalized, structured data—the foundation of data analytics and modern automation tools.

By downloading, you agree to the DDC terms of use 

✕

🚀 Welcome to the future of data in construction!

You're taking your first step into the world of open data, working with normalized, structured data—the foundation of data analytics and modern automation tools.

By downloading, you agree to the DataDrivenConstruction terms of use 

Stay ahead with the latest updates on converters, tools, AI, LLM
and data analytics in construction — Subscribe now!

✕
DataDrivenConstruction offers workshops tested and practiced on global leaders in the construction industry to help your team navigate and leverage the power of data and artificial intelligence in your company's decision making.

Reserve your spot now to rethink your
approach to decision making!

✕


🚀 Welcome to the future of data in construction!

By downloading, you agree to the DataDrivenConstruction terms of use 

Stay ahead with the latest updates on converters, tools, AI, LLM
and data analytics in construction — Subscribe now!

✕
Have a question or need more information? Reach out to us directly!
Schedule a time to discuss your needs with our team.
Tailored sessions to help your team grow — let's plan together!
✕
Have you attended one of our workshops, read our book, or used our solutions? Share your thoughts with us!
Name
✕
Data Maturity Diagnostics

🧰 Data-Driven Readiness Check

This short assessment will help you identify your company's data management pain points and offer solutions to improve project efficiency. It takes only 1–2 minutes to complete and you will receive personalized recommendations tailored to your needs.

✕

Clean & Organized Data

Theoretical Chapters:

Practical Chapters:

What You'll Find on
DDC Solutions:

  • CAD/BIM to spreadsheet/database converters (Revit, AutoCAD, IFC, Microstation)
  • Ready-to-deploy n8n workflows for construction processes
  • ETL pipelines for data synchronization between systems
  • Customizable Python scripts for repetitive tasks
  • Intelligent data validation and error detection
  • Real-time dashboard connectors
  • Automated reporting systems
✕

Connect Everything

Theoretical Chapters:

Practical Chapters:

What You'll Find on
DDC Solutions:

  • CAD/BIM to spreadsheet/database converters (Revit, AutoCAD, IFC, Microstation)
  • Ready-to-deploy n8n workflows for construction processes
  • ETL pipelines for data synchronization between systems
  • Customizable Python scripts for repetitive tasks
  • Intelligent data validation and error detection
  • Real-time dashboard connectors
  • Automated reporting systems
✕

Add AI & LLM Brain

Theoretical Chapters:

Practical Chapters:

What You'll Find on
DDC Solutions:

  • CAD/BIM to spreadsheet/database converters (Revit, AutoCAD, IFC, Microstation)
  • Ready-to-deploy n8n workflows for construction processes
  • ETL pipelines for data synchronization between systems
  • Customizable Python scripts for repetitive tasks
  • Intelligent data validation and error detection
  • Real-time dashboard connectors
  • Automated reporting systems
149 Example of big data based on CAD data (BIM)
This website uses cookies to improve your experience. By using this website you agree to our Data Protection Policy.
Read more
×