image131
085 4D model integrating time into construction estimates
10 June 2025
image1
087 Extended attribute layers 6D -8D from energy efficiency to safety assurance
10 June 2025

086 Construction schedule and its automation based on costing data

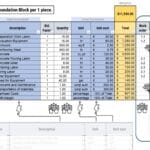
The construction schedule is a visual representation of the plan of activities and processes to be performed as part of the project implementation. It is created on the basis of detailed resource calculations (Fig. 5.3-1), where each task-job is scheduled, in addition to the cost of resources, by time and sequence.

In contrast to averaging approaches, where time calculations are based on a typical number of hours for installing materials or equipment, in the resource-based method, planning is based on actual data in the costing. Each item of the estimate related to labor costs is based on the applied calendar, which takes into account the actual conditions of resource use during the working period. Adjustment of productive hours through coefficients at the level of calculations (Fig. 5.3-1 parameter “Bid. Factor”), allows to take into account differences in productivity and seasonal peculiarities affecting the timing of work.

To determine the process start and end dates for the construction schedule in the Gantt chart, we take the values of the time volume attribute for each item from the foundation block costing and multiply them by the number of blocks (in this case, the number of concrete foundation blocks). This calculation gives the duration of each task. We then plot these durations on a timeline, starting from the project start date, to plot a graph and the result is a visual representation showing when each task should start and finish. The “Work order” parameter for processes additionally allows us to understand whether the work process is running in parallel (“Work order” e.g. 1.1-1.1) or sequentially (1.1-1.2).

Gantt Chart is a graphical tool for planning and project management that represents tasks as horizontal bars on a timeline. Each bar represents the duration of the task, its start and end.

A schedule, or Gantt chart, helps project managers and workers clearly understand when and in what sequence the various phases of construction should be performed, ensuring efficient use of resources and meeting deadlines.

Let’s present a schedule for the installation of three concrete foundation blocks using the calculations from the table above. Using the cost table (Fig. 5.3-1) from the example above, let’s ask LLM to schedule the installation of 3 foundation block elements, e.g. for the first of May 2024.

To send a costing to LLM, we can upload the costing table in XLSX format or simply insert a screenshot of a JPEG image of the costing directly into the LLM chat (Fig. 5.3-1). LLM will independently find a library to visualize the table image and, by multiplying the time attributes of the activities from the table by their volume, will add all the data into a graph.

  • Send a text request to the LLM at:

    Create a work schedule in the form of a Gantt chart using values from the time related table (Fig. 5.3-1 as JPEG in the appendix) for the installation of 3 foundation blocks. The work for each block shall be performed sequentially. Set the start of work to 01/05/2024

  • LLM’s response
image143
Fig. 5.3-2 Automatically generated by multiple LLMs Gantt chart shows the stages of construction of three concrete blocks, according to the conditions from the prompt.

The resulting graph (Fig. 5.3-2) is a time diagram in which each horizontal bar corresponds to a certain stage of work on the foundation block and shows the sequence of operations (parameter “Work order”), such as preparation, excavation, formwork installation, reinforcement, concrete pouring and finishing, i.e. those processes that have filled in time parameters and sequence in the calculations.

Such a schedule (Fig. 5.3-2) does not take into account constraints related to working days, shifts or working time standards, but is intended solely for conceptual visualization of the process. An accurate schedule that will reflect the concurrency of work can be supplemented with appropriate prompts or additional instructions within the chat room

Using a single costing (Fig. 5.3-1), thanks to volume attributes from 3D -geometry, it is possible to automatically estimate both the project cost through automated estimates and at the same time to calculate the time characteristics of groups in the form of tables or graphs for different project variants (Fig. 5.3-3).

image28
Fig. 5.3-3 Automatic Calculation, allows you to instantly and automatically forecast costs and time for various project options.

Modern modular ERP -systems (Fig. 5.4-4), loading data from CAD models use similar automated time calculation methods that significantly reduce the decision-making process. This allows you to instantly and accurately plan work schedules and calculate the total time required to complete all tasks in the project realization, taking into account real prices.

.

Change language

Post's Highlights

Stay updated: news and insights


We’re Here to Help

Fresh solutions are released through our social channels

Leave a Reply

Your email address will not be published. Required fields are marked *

Focus Areas

navigate
  • ALL THE CHAPTERS IN THIS PART
  • A PRACTICAL GUIDE TO IMPLEMENTING A DATA-DRIVEN APPROACH (8)
  • CLASSIFICATION AND INTEGRATION: A COMMON LANGUAGE FOR CONSTRUCTION DATA (8)
  • DATA FLOW WITHOUT MANUAL EFFORT: WHY ETL (8)
  • DATA INFRASTRUCTURE: FROM STORAGE FORMATS TO DIGITAL REPOSITORIES (8)
  • DATA UNIFICATION AND STRUCTURING (7)
  • SYSTEMATIZATION OF REQUIREMENTS AND VALIDATION OF INFORMATION (7)
  • COST CALCULATIONS AND ESTIMATES FOR CONSTRUCTION PROJECTS (6)
  • EMERGENCE OF BIM-CONCEPTS IN THE CONSTRUCTION INDUSTRY (6)
  • MACHINE LEARNING AND PREDICTIONS (6)
  • BIG DATA AND ITS ANALYSIS (5)
  • DATA ANALYTICS AND DATA-DRIVEN DECISION-MAKING (5)
  • DATA CONVERSION INTO A STRUCTURED FORM (5)
  • DESIGN PARAMETERIZATION AND USE OF LLM FOR CAD OPERATION (5)
  • GEOMETRY IN CONSTRUCTION: FROM LINES TO CUBIC METERS (5)
  • LLM AND THEIR ROLE IN DATA PROCESSING AND BUSINESS PROCESSES (5)
  • ORCHESTRATION OF ETL AND WORKFLOWS: PRACTICAL SOLUTIONS (5)
  • SURVIVAL STRATEGIES: BUILDING COMPETITIVE ADVANTAGE (5)
  • 4D-6D and Calculation of Carbon Dioxide Emissions (4)
  • CONSTRUCTION ERP AND PMIS SYSTEMS (4)
  • COST AND SCHEDULE FORECASTING USING MACHINE LEARNING (4)
  • DATA WAREHOUSE MANAGEMENT AND CHAOS PREVENTION (4)
  • EVOLUTION OF DATA USE IN THE CONSTRUCTION INDUSTRY (4)
  • IDE WITH LLM SUPPORT AND FUTURE PROGRAMMING CHANGES (4)
  • QUANTITY TAKE-OFF AND AUTOMATIC CREATION OF ESTIMATES AND SCHEDULES (4)
  • THE DIGITAL REVOLUTION AND THE EXPLOSION OF DATA (4)
  • Uncategorized (4)
  • CLOSED PROJECT FORMATS AND INTEROPERABILITY ISSUES (3)
  • MANAGEMENT SYSTEMS IN CONSTRUCTION (3)
  • AUTOMATIC ETL CONVEYOR (PIPELINE) (2)

Search

Search

057 Speed of decision making depends on data quality

Today’s design data architecture is undergoing fundamental changes. The industry is moving away from bulky, isolated models and closed formats towards more flexible, machine-readable structures focused on analytics, integration and process automation. However, the transition...

060 A common language of construction the role of classifiers in digital transformation

In the context of digitalization and automation of inspection and processing processes, a special role is played by classification systems elements – a kind of “digital dictionaries” that ensure uniformity in the description and parameterization...

061 Masterformat, OmniClass, Uniclass and CoClass the evolution of classification systems

Historically, construction element and work classifiers have evolved in three generations, each reflecting the level of available technology and the current needs of the industry in a particular time period (Fig. 4.2-8): First generation (early...

Don't miss the new solutions


Linux

macOS

Looking for the Linux or MAC version? Send us a quick message using the button below, and we’ll guide you through the process!


📥 Download OnePager

Welcome to DataDrivenConstruction—where data meets innovation in the construction industry. Our One-Pager offers a concise overview of how our data-driven solutions can transform your projects, enhance efficiency, and drive sustainable growth. 

🚀 Welcome to the future of data in construction!

You're taking your first step into the world of open data, working with normalized, structured data—the foundation of data analytics and modern automation tools.

By downloading, you agree to the DataDrivenConstruction terms of use 

Stay ahead with the latest updates on converters, tools, AI, LLM
and data analytics in construction — Subscribe now!

🚀 Welcome to the future of data in construction!

You're taking your first step into the world of open data, working with normalized, structured data—the foundation of data analytics and modern automation tools.

By downloading, you agree to the DataDrivenConstruction terms of use 

Stay ahead with the latest updates on converters, tools, AI, LLM
and data analytics in construction — Subscribe now!

🚀 Welcome to the future of data in construction!

You're taking your first step into the world of open data, working with normalized, structured data—the foundation of data analytics and modern automation tools.

By downloading, you agree to the DDC terms of use 

🚀 Welcome to the future of data in construction!

You're taking your first step into the world of open data, working with normalized, structured data—the foundation of data analytics and modern automation tools.

By downloading, you agree to the DataDrivenConstruction terms of use 

Stay ahead with the latest updates on converters, tools, AI, LLM
and data analytics in construction — Subscribe now!

DataDrivenConstruction offers workshops tested and practiced on global leaders in the construction industry to help your team navigate and leverage the power of data and artificial intelligence in your company's decision making.

Reserve your spot now to rethink your
approach to decision making!

Please enable JavaScript in your browser to complete this form.


🚀 Welcome to the future of data in construction!

By downloading, you agree to the DataDrivenConstruction terms of use 

Stay ahead with the latest updates on converters, tools, AI, LLM
and data analytics in construction — Subscribe now!

Have a question or need more information? Reach out to us directly!
Schedule a time to discuss your needs with our team.
Tailored sessions to help your team grow — let's plan together!
Have you attended one of our workshops, read our book, or used our solutions? Share your thoughts with us!
Please enable JavaScript in your browser to complete this form.
Name
Data Maturity Diagnostics

🧰 Data-Driven Readiness Check

This short assessment will help you identify your company's data management pain points and offer solutions to improve project efficiency. It takes only 1–2 minutes to complete and you will receive personalized recommendations tailored to your needs.

🚀 Goals and Pain Points

What are your biggest obstacles today — and your goals for the next 6 months? We’ll use your answers to build a personalized roadmap.

Build your automation pipeline

 Understand and organize your data

Automate your key process

Define a digital strategy

Move from CAD (BIM) to databases and analytics

Combine BIM, ERP and Excel

Convince leadership to invest in data

📘  What to Read in Data-Driven Construction Guidebook

Chapters 1.2, 4.1–4.3 – Technologies, Data Conversion, Structuring, Modeling:

  • Centralized vs fragmented data

  • Principles of data structure

  • Roles of Excel, DWH, and databases

Chapters 5.2, 7.2 – QTO Automation, ETL with Python:

  • Data filtering and grouping

  • Automating QTO and quantity takeoff

  • Python scripts and ETL logic

Chapter 10.2 – Roadmap for Digital Transformation:

  • Strategic stages of digital change

  • Organizational setup

  • Prioritization and execution paths

Chapters 4.1, 8.1–8.2 – From CAD (BIM) to Storage & Analytics:

  • Translating Revit/IFC to structured tables

  • BIM as a database

  • Building analytical backends

Chapters 7.3, 10.2 – Building ETL Pipelines + Strategic Integration:

  • Combining Excel, BIM, ERP

  • Automating flows between tools

  • Connecting scattered data sources

Chapters 7.3, 7.4 – ETL Pipelines and Orchestration (Airflow, n8n):

  • Building pipelines

  • Scheduling jobs

  • Using tools like Airflow or n8n to control the flow 

Chapters 2.1, 10.1 – Fragmentation, ROI, Survival Strategy:

  • Hidden costs of bad data

  • Risk of inaction

  • ROI of data initiatives

  • Convincing stakeholders

Download the DDC Guidebook for Free


🎯 DDC Workshop That Solves Your Puzzle

Module 1 – Data Automation and Workflows in Construction:
  • Overview of data sources
  • Excel vs systems
  • Typical data flows in construction
  • Foundational data logic

Module 3 – Automated Data Processing Workflow:
  • Setting up ETL workflows
  • CAD/BIM extraction
  • Automation in Excel/PDF reporting

Module 8 – Converting Unstructured CAD into Structured Formats 
  • From IFC/Revit to tables
  • Geometric vs semantic data
  • Tools for parsing and transforming CAD models

Module 13 – Key Stages of Transformation 
  • Transformation roadmap
  • Change management
  • Roles and responsibilities
  • KPIs and success metrics

Module 8 – Integrating Diverse Data Systems and Formats
  • Excel, ERP, BIM integration
  • Data connection and file exchange
  • Structuring hybrid pipelines

Module 7 – Automating Data Quality Assurance Processes 
  • Rules and checks
  • Dashboards
  • Report validation
  • Automated exception handling

Module 10 – Challenges of Digitalization in the Industry 
  • How to justify investment in data
  • Stakeholder concerns
  • ROI examples
  • Failure risks

💬 Individual Consultation – What We'll Discuss

Audit of your data landscape 

We'll review how data is stored and shared in your company and identify key improvement areas.

Select a process for automation 

We'll pick one process in your company that can be automated and outline a step-by-step plan.

Strategic roadmap planning 

Together we’ll map your digital transformation priorities and build a realistic roadmap.

CAD (BIM) - IFC/Revit model review 

We'll review your Revit/IFC/DWG data and show how to convert it into clean, structured datasets.

Mapping integrations across tools 

We’ll identify your main data sources and define how they could be connected into one workflow.

Plan a pilot pipeline (PoC) 

We'll plan a pilot pipeline: where to start, what tools to use, and what benefits to expect.

ROI and stakeholder alignment 

📬 Get Your Personalized Report and Next Steps

You’ve just taken the first step toward clarity. But here’s the uncomfortable truth: 🚨 Most companies lose time and money every week because they don't know what their data is hiding. Missed deadlines, incorrect reports, disconnected teams — all symptoms of a silent data chaos that gets worse the longer it's ignored.

Please enter your contact details so we can send you your customized recommendations and next-step options tailored to your goals.

💡 What you’ll get next:

  • A tailored action plan based on your answers

  • A list of tools and strategies to fix what’s slowing you down

  • An invite to a free 1:1 session to discuss your case

  • And if you choose: a prototype (PoC) to show how your process could be automated — fast.

086 Construction schedule and its automation based on costing data
This website uses cookies to improve your experience. By using this website you agree to our Data Protection Policy.
Read more
×