
In addition to technical integration, an important factor in the successful implementation of digital solutions is their adoption by end users. Engaging customers or users in performance measurement is both a challenge of improving user experience and managing change in the company. If a solution doesn’t fit into a familiar workflow or doesn’t solve real user or customer problems, it won’t be used, and no amount of additional measures and incentives will fix that.
Transformation is an iterative process based on analyzing user interaction data with new processes, with frequent testing cycles, constant feedback and refinements.
Step 5: Build a data culture, train staff and collect feedback
Even the most advanced system won’t work without employee engagement. You need to create an environment where data is used on a daily basis and the team understands its value.
The published UK government report “Data Analytics and AIin Government Project Delivery” 2024 notes (gov.uk, “Data Analytics and AI in Government Project Delivery,” 20 Mar. 2024) that the training of professionals with the necessary competencies in data processing and interpretation is critical to the successful implementation of data analytics and AI.
Lack of data analytics expertise is one of the key issues limiting digital transformation. Leaders are used to established routines: quarterly cycles, prioritized initiatives, and traditional ways of moving projects forward. Change requires a distinctive leader – high enough in rank to have influence, but not so high that he or she has the time and motivation to lead a long-term transformation project.
Main Actions:
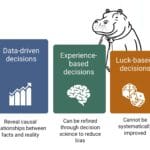
- Recognizing the need to move from subjective decisions based on the opinion of a highly paid employee (HiPPO) to a decision-making culture based on facts and data, as discussed in the chapter “HiPPO or the Danger of Opinion in Decision Making” (Fig. 2.1-9).
- Organize systematic training:
- Hold trainings on how to use structured data, and invite experts from other industries who don’t have a bias toward products and concepts popular in the construction industry today
- Discuss data analysis approaches and tools with colleagues, and independently learn hands-on work with tools such as Python, pandas, and LLM (Fig. 4.1-3, Fig. 4.1-6)
- Create a library of tutorials (preferably with short videos) on the topic of structuring data (Fig. 3.2-15) and creating data models (Fig. 4.3-6, Fig. 4.3-7)
- Utilize modern learning technologies:
- Use language models (LLMs) to support code and data manipulation, including code generation, refactoring, and analysis, as well as processing and interpreting tabular information (Fig. 3.4-1)
- Explore how LLM-generated code can be customized and integrated into a complete Pipeline solution when working in an offline development environment (IDE) (Fig. 4.4-14, Fig. 5.2-13)
When a manager continues to make decisions the “old fashioned way,” no amount of training will convince people to take analytics seriously.
Building a data culture is impossible without constant feedback. Feedback allows you to identify gaps in processes, tools and strategies that cannot be discovered through internal reports or formal KPIs metrics. Complimentary comments from users of your solutions will not provide practical value. It is critical feedback that is valuable, especially if it is based on specific observations and facts. But obtaining such information requires effort: you need to build processes where participants – both internal and external – can share comments (it may make sense to do so anonymously) without distortion and without fear that their opinions may affect their own work. It is important that they do so without distortion and without fear of negative consequences for themselves.
Any learning is ultimately self-learning (M. J. Perry, “My Favorite Milton Friedman Quotes,” 17 November 2006).
– Milton Friedman, American economist and statistician
Implementation of analytical tools should be accompanied by regular verification of their effectiveness in practice (ROI, KPIs), which can only be achieved through structured feedback from employees, customers and partners. This allows companies not only to avoid repeating mistakes, but also to adapt faster to changes in the environment. Having a mechanism for collecting and analyzing feedback is one of the signs of maturity of an organization moving from episodic digital initiatives to a sustainable model of continuous improvement (Fig. 2.2-5).
Step 6: From pilot projects to scaling up
Pick battles big enough to matter and small enough to win.
– Jonathan Kozol
Launching digital transformation “all at once and everywhere” is extremely risky. A more effective approach is to start with pilot projects and gradually scale up successful practices.
Main Actions:
- Choose the right project for the pilot:
- Define a specific business objective or process with measurable results (KPI, ROI) (Fig. 7.1-5)
- Select an ETL automation process, such as automatic data validation or workload calculation (QTO) using Python and Pandas (Fig. 5.2-10
- Establish clear metrics for success (e.g., reduce the time to write inspection specifications or data validation reports from a week to a day)
- Take iterative approaches:
- Start with simple data conversion processes and create streaming conversions of multi-format data into the formats you need for your processes (Fig. 4.1-2, Fig. 4.1-5)
- Gradually increase the complexity of tasks and expand the automation of processes by forming a complete Pipeline in the IDE based on documented code blocks (Fig. 4.1-7, Fig. 7.2-18).
- Document and record (preferably with short videos) successful solutions and share them with colleagues or in professional communities
- Develop templates and accompanying documentation to replicate such solutions so that they can be used effectively by your colleagues (or members of the professional community, including social media users)
Phased “rolling up” allows you to maintain the high quality of changes and not fall into the chaos of parallel implementations. The “from small to big” strategy minimizes risks and allows you to learn from small mistakes without letting them grow into critical problems.
Moving from a project-based approach, where employees are only partially involved, to the formation of permanent teams (e.g., centers of expertise – CoE) allows for sustainable product development even after the first version of the product is released. Such teams not only support existing solutions, but also continue to improve them.
This reduces dependence on lengthy approvals: team members are empowered to make decisions within their area of responsibility. As a result, managers are freed from the need to micromanage, and teams can focus on creating real value.
Developing new solutions is not a sprint, but a marathon. Those who succeed in it are those who are initially focused on long-term, consistent work.
It is important to realize that technology requires constant development. Investing in the long-term development of technological solutions is the basis for successful work.
Step 7: Use open data formats and solutions
As we discussed in the chapters on modular platforms (ERP, PMIS, CAFM, CDE, etc.), it is important to focus on open and universal data formats that ensure independence from vendor solutions and increase the availability of information for all stakeholders.
Main Actions:
- Move from closed formats to open formats:
- Use open formats instead of proprietary formats, or find a way to set up automatic upload or conversion of closed formats to open formats (Fig. 3.2-15).
- Implement tools to work with Parquet, CSV, JSON, XLSX, which are the exchange standards between most modern systems (Fig. 8.1-2)
- If working with 3D geometry plays an important role in your processes, consider using open formats such as USD, glTF, DAE, or OBJ (Fig. 3.1-14)
- Use vector databases for efficient analysis and information retrieval:
- Use Bounding Box and other methods to simplify the 3D -geometry (Fig. 8.2-1)
- Think about where you can implement data vectorization – converting texts, objects, or documents into numerical representations (Fig. 8.2-2)
- Apply big data analytics tools:
- Organize the storage of accumulated historical data (e.g. PDF, XLSX, CAD) in formats suitable for analysis (Apache Parquet, CSV, ORC) (Fig. 8.1-2).
- Begin to apply basic statistical methods and work with representative samples – or at a minimum, familiarize yourself with the fundamental principles of statistics (Fig. 9.2-5)
- Implement and learn tools to visualize data and the relationships between data to visualize the results of analysis. Without good visualization, it is impossible to fully understand the data itself or the processes based on it (Fig. 7.1-4).
The move to open data formats and the introduction of tools for analyzing, storing and visualizing information lays the foundation for sustainable and independent digital governance. This not only reduces dependence on vendors, but also ensures equal access to data for all stakeholders.
Step 8. Start implementing machine learning for prediction
Many companies have accumulated vast amounts of data – a kind of “information geysers” that are still unused. This data has been collected in hundreds or thousands of projects, but has often been used only once or not at all in further processes. Documents and models stored in closed formats and systems are often perceived as obsolete and useless ballast. In reality, however, they are a valuable resource – the basis for analyzing mistakes made, automating routine operations, and developing innovative solutions for auto-classification and feature recognition in future projects.
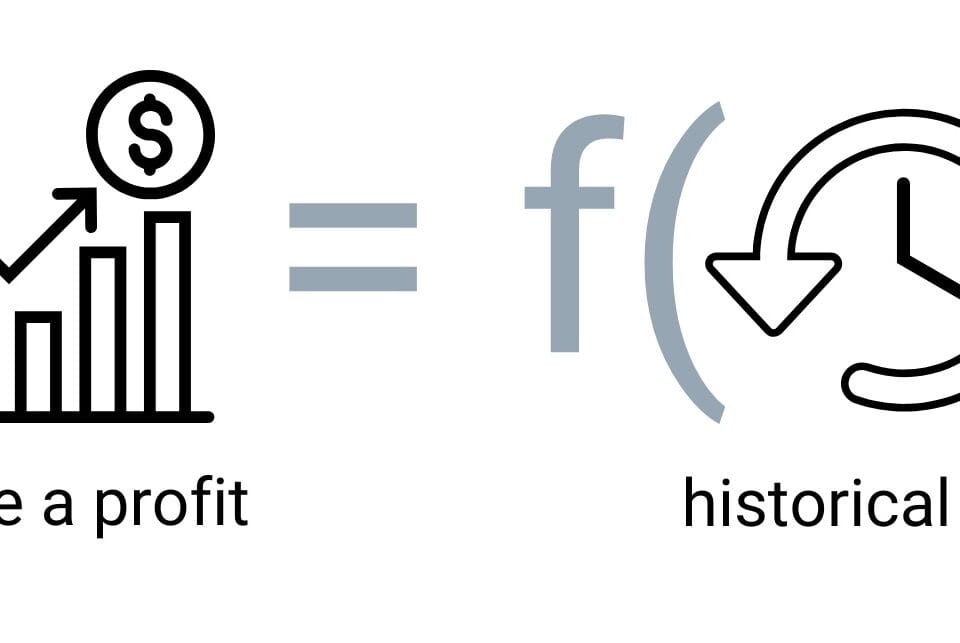
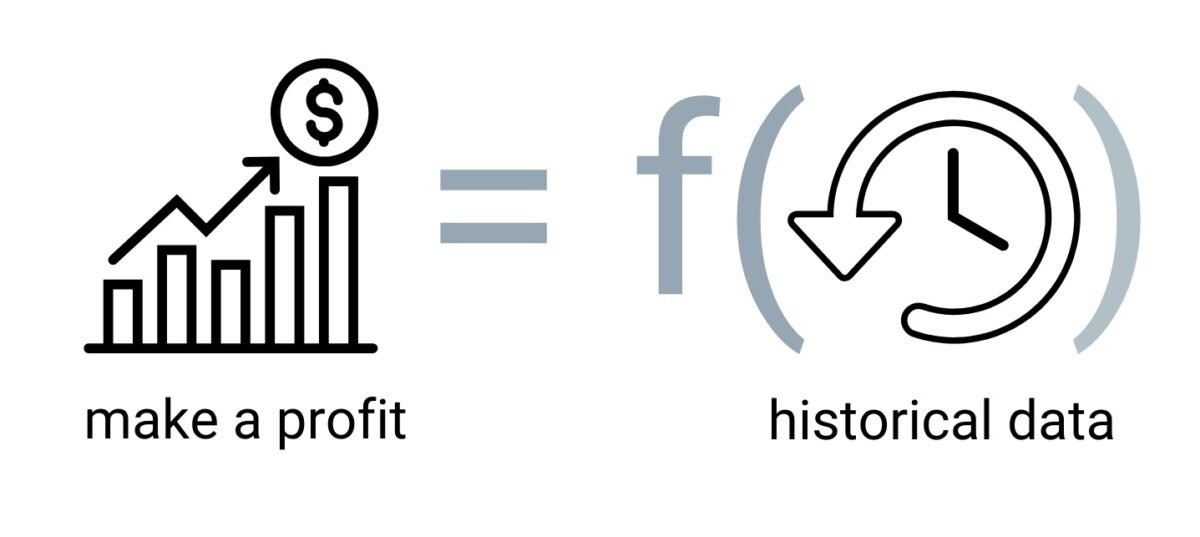
The key challenge is to learn how to extract this data and transform it into actionable insights. As discussed in the chapter on Machine Learning and Predictions, machine learning techniques have the potential to significantly improve the accuracy of estimates and predictions in a variety of construction-related processes. Fully utilizing the accumulated data opens the way to improving efficiency, reducing risk, and building sustainable digital processes.
Main Actions:
- Start with simple algorithms:
- Try applying linear regression – using hints from the LLM – to predict recurring performance in data sets where dependencies on a large number of factors are absent or minimal (Fig. 9.3-4)
- Consider at which stages of your processes the k-nearest neighbor (k-NN) algorithm could theoretically be applied – for example, for classification tasks, object similarity assessment, or forecasting based on historical analogs (Fig. 9.3-5).
- Collect and structure data to train models:
- Collect historical project data in one place and in a single format (Fig. 9.1-10)
- Work on the quality and representativeness of training samples, through automated ETL (Fig. 9.2-8)
- Learn to separate the data into training and test sets, as we did in the Titanic dataset example (Fig. 9.2-6, Fig. 9.2-7)
- Consider expanding the application of machine learning techniques to solve a wide range of problems, from predicting project timelines to optimizing logistics, resource management, and early identification of potential problems
Machine learning is a tool to turn archived data into a valuable asset for prediction, optimization, and informed decision making. Start with small datasets (Fig. 9.2-5) and simple models, gradually increasing in complexity.
Step 9. Integrate IoT and modern data collection technologies
The construction world is rapidly becoming digital: every construction photo, every Teams post is already part of a larger process of parameterizing and tokenizing reality. Just as GPS once transformed logistics, IoT, RFID and automated data collection are changing the construction industry. As discussed in the chapter “IoT Internet of Things and Smart Contracts,” a digital construction site with sensors and automated monitoring is the future of the industry.
Main Actions:
- Implement IoT -devices, RFID -tags and detail the processes associated with them:
- Evaluate which areas or project phases of a project can benefit from sensor installation with the greatest return on investment (ROI) – for example, for monitoring temperature, vibration, humidity or movement
- Consider using RFID to track materials, tools and equipment throughout the supply chain
- Consider how the collected data can be integrated into a unified information system, such as Apache NiFi, for automated processing and real-time analysis (Fig. 7.4-5)
- Establish a real-time monitoring system:
- Develop dashboards to track key process or project metrics using visualization tools such as Streamlit, Flask or Power BI)
- Set up automatic notifications to signal critical deviations from the plan or norms (Fig. 7.4-2)
- Assess the potential for predictive maintenance of equipment based on the data collected and patterns identified (Fig. 9.3-6)
- Combine data from different sources:
- Start by visualizing the data model at the physical level – reflect the structure of information flows and key parameters coming from CAD systems, IoT devices and ERP platforms (Fig. 4.3-1)
- Start by creating a rough outline of a unified platform for data analysis and management decision support. Capture key functions, data sources, users, and envisioned application scenarios (Fig. 4.3-7).
The sooner you start connecting real-world processes to the digital world, the faster you can manage them with data – efficiently, transparently and in real time.
Step 10. Prepare for the future of changes in the industry
Construction companies are constantly under pressure from the external environment: economic crises, technological leaps, regulatory changes. Just like a forest that has to withstand rain, snow, drought and scorching sun, companies live in an environment of continuous adaptation. And just as trees become resilient to frost and drought through deep root systems, only those organizations that have a solid foundation of automated processes, the ability to anticipate change and flexibly adapt strategies remain viable and competitive.
As mentioned in the chapter “Survival Strategies: Building Competitive Advantage”, the construction industry is entering a phase of radical transformation. The interaction between client and contractor is moving towards a model of persuasion, where transparency, predictability and digital tools are replacing traditional approaches. In this new reality, it is not the largest, but the most flexible and technologically mature that win.
Main Actions:
- Analyze business vulnerabilities in the context of open data:
- Assess how democratizing access to data as part of Uberization could have a devastating impact on your competitive advantage and your business (Fig. 10.1-5)
- Think about a strategy to move from opaque and siloed processes to business models based on open solutions, system interoperability and data transparency (Fig. 2.2-5).
- Develop a long-term digital strategy:
- Determine whether you aspire to be an innovation leader or prefer a “catch-up” scenario in which you will conserve your resources
- Describe the stages: short-term (process automation, data structuring), medium-term (implementation of LLM and ETL), long-term (digital ecosystems, centralized repositories)
- Think about expanding your service portfolio:
- Consider offering new services (focused on energy efficiency, ESG, data services). We will talk more about new business models in the next chapter
- Strive to position yourself as a reliable technology partner that accompanies the entire life cycle of a facility, from design to operation. Your credibility should be based on your systematic approach, transparent processes and ability to provide sustainable technology solutions
In a transformational environment, it is not those who simply react to change who win, but those who are proactive. Flexibility, openness and digital maturity are the foundations of sustainability in building tomorrow.


