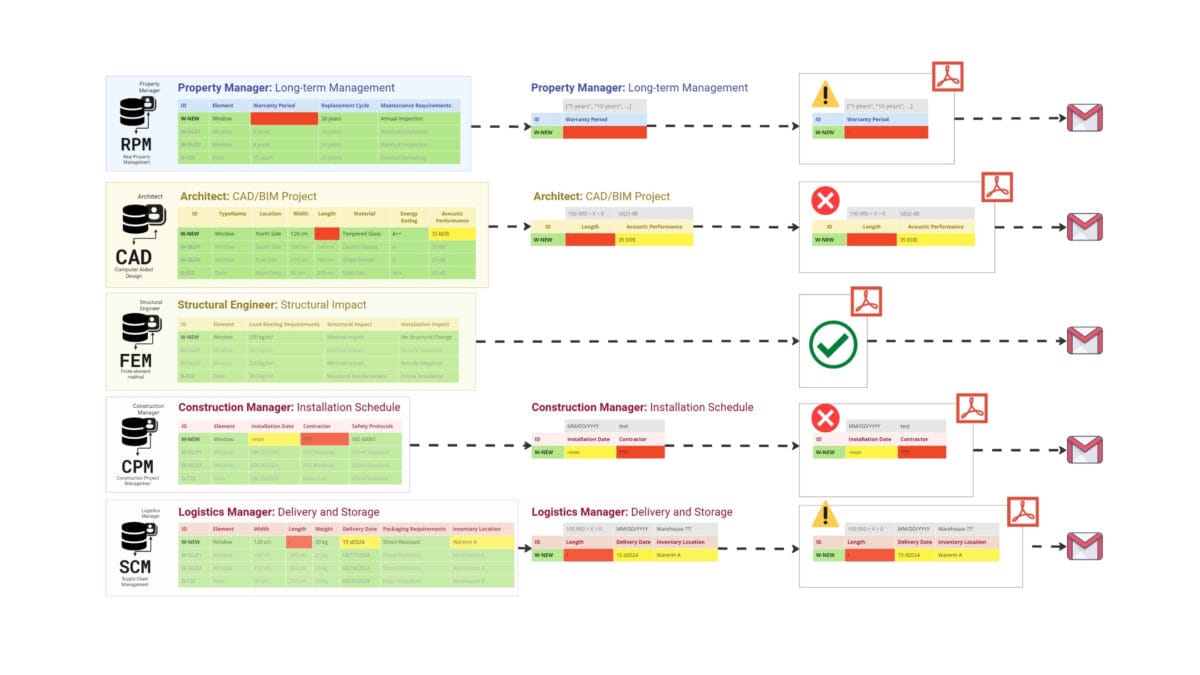
Visualization options for validation results in addition to summary tables can include dashboards, charts, or PDF documents that categorize items into groups based, for example, on their status - green for validated items, yellow for items requiring attention, and red for unvalidated items.
During the verification process, we consistently analysed the data (entities) from each system - from property management and CAD (BIM) data to installation schedules and logistics. In order to visualise the result of the audit, we will now automatically create suitable PDF documents for each specialist with a description of the results depending on the outcome of the audit:
- Document without comment: "Thank you for working together."
- Document with comments: "This document lists items and their attributes that have not passed the requirements validation."

Validation and automatic creation of reporting documents speeds up the process of finding and eliminating data deficiencies
With an automated validation process - as soon as an error or data gap is detected, we can instantly send a notification in the form of a message or a PDF document to the person responsible for the relevant data with a list of elements or entity groups with a description of the attributes that have not been validated

Visualization of inspection results in the form of automatically generated documents facilitates data interpretation and promotes effective interaction between project participants
For example, if a property management system receives a dossier that shows an incorrectly populated «Warranty Period» attribute, the property manager receives an alert with a list of their attributes that need to be checked and corrected. Similarly, any deficiencies in the installation schedule or logistics data cause a report to be automatically generated and an e-mail sent with the results of the audit to the appropriate specialist.
In addition to PDF documents and graphs with results, it is possible to create interactive 3D models with highlighting of elements with missing attributes, which allows users to visually use 3D geometries of elements to filter and evaluate the quality and completeness of data of elements in the project.
Visualization of the inspection results in the form of automatically generated documents, graphs or dashboards greatly simplifies data interpretation andfacilitates effective interaction between project participants.
Automating the data verification process has much in common with ETL procedures. In the chapter "ETL and Data Verification Automation" we will take a closer look at the topic of ETL and automation techniques for data verification.
After learning the basic types of data and systems, and mastering how to mine quality data to populate the systems, we move on to the key aspects of construction: estimating project cost and time, including volume estimation, costing, and scheduling.


