image80
052 Example of converting a PDF -document into a table
27 January 2025
RAG and ETL working with CAD/BIM projects in 2025
28 January 2025

054 Converting text data into a structured form

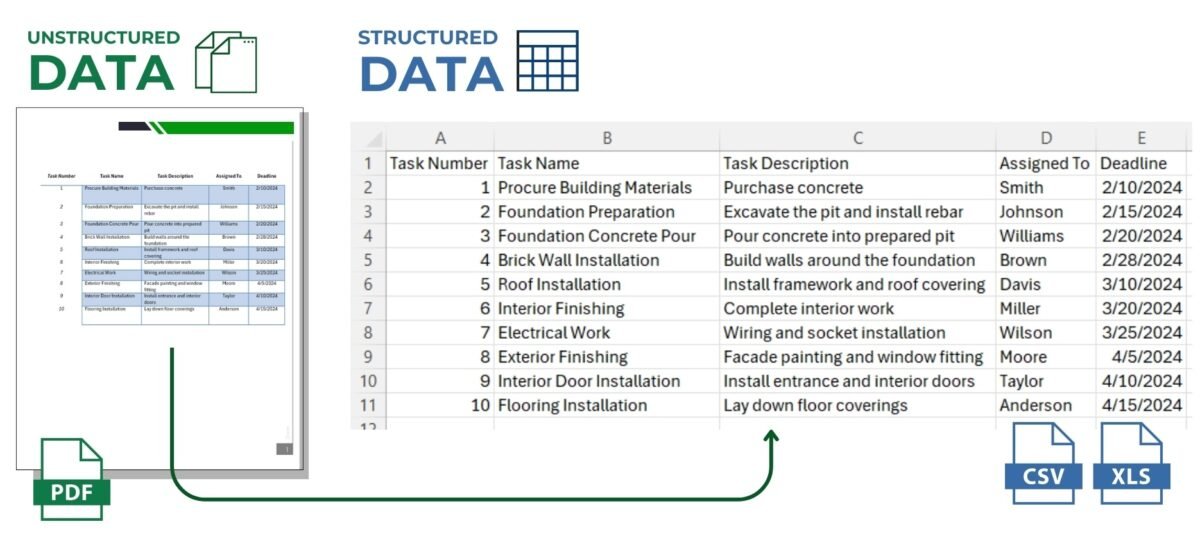
In addition to PDF documents with tables (Fig.‎ 4.1-2) and scanned versions of tabular forms (Fig.‎ 4.1-5), a significant part of information in project documentation is presented in text form. It can be both coherent sentences in text documents and fragmentary records scattered over drawings and schemes. In modern conditions of data processing one of the most common tasks is to convert such text into a structured format suitable for analysis, visualization and decision making.

Central to this process is taxonomy, a classification system that organizes information into categories and subcategories based on common features.

A taxonomy is a hierarchical classification structure used to group and organize objects. In the context of text processing, it serves as a basis for systematically categorizing items into semantic categories, thus simplifying analysis and improving the quality of data processing.

Taxonomy creation is accompanied by the steps of entity extraction, categorization and contextualization. To simulate the process of extracting information from textual data, we need to perform the following steps, similar to those we have already applied to structuring data from PDF documents:

  • Data extraction (Extract): you need to analyze text data to extract information about delays and changes in the project schedule.
  • Categorization and Classification (Transofrm): categorize the information received, e.g. Reasons for delays and schedule changes.
  • Integration (Load): at the end we prepare structured data for integration into external data management systems.

Consider a situation: we have a dialog between a project manager and an engineer discussing problems with the schedule. Our goal is to extract the key elements (reasons for delay, schedule adjustments) and present them in a structured way (Fig. 4.1-7).

Let’s perform the extraction based on the expected keywords, create a DataFrame to simulate data extraction and after transformation, a new DataFrame table that will contain columns for date, event (e.g., reason for delay) and action (e.g., schedule change).

image67
Fig. 4.1-7 Highlight key information from the text about the need to adjust timelines and integrate changes into the project management system.

Here is the code to solve the problem using a text query in one of the language models as in the previous examples.

  • Send a text request to any LLM chat room:

    I have a conversation between a manager, “Hello, we are behind schedule due to rain” and an engineer, “Yes, we need to adjust the deadline by a week”. I need a script that will analyze future similar text conversations, extract the reasons for delays and necessary deadline adjustments, and then generate a DataFrame from that data. The DataFrame should then be saved to a CSV -file ⏎
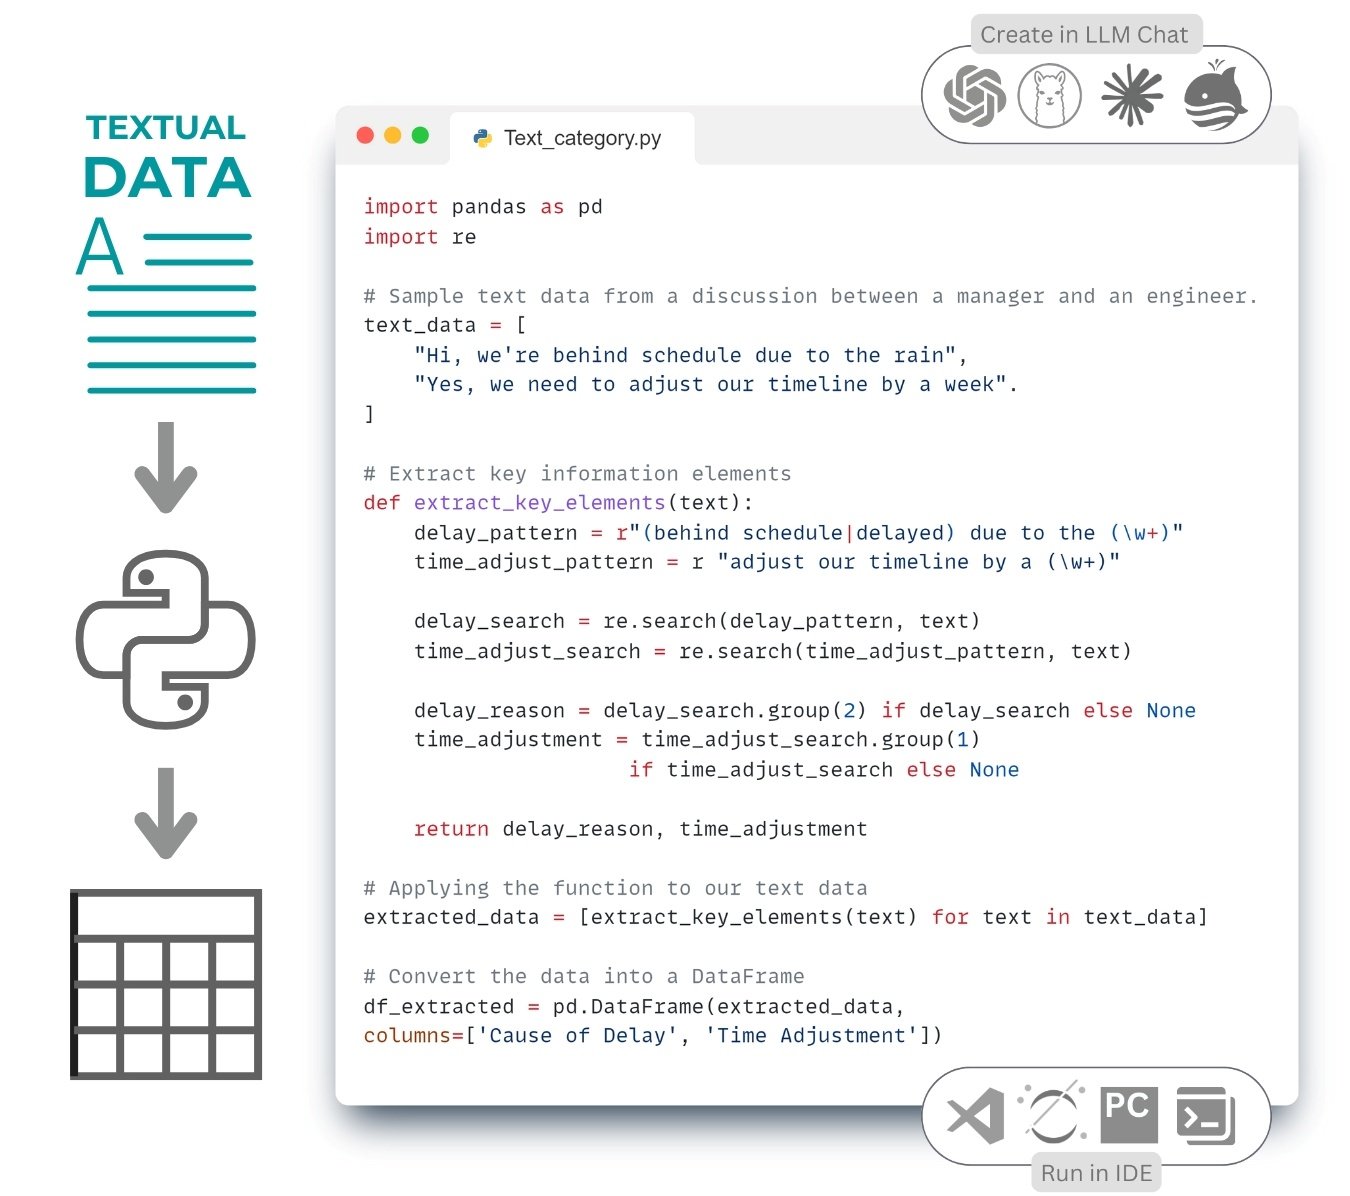
  • The response from LLM will typically include Python -code using regular expressions (re – Regex) and the Pandas (pd) library:
image111
Fig. 4.1-8 Highlighting key information from the text about the need to adjust deadlines in a table.

In this example (Fig. 4.1-7), text data containing correspondence between a project manager and an engineer is analyzed to identify and extract specific information that may affect the management of future projects with similar dialogs. Using regular expressions (we’ll talk more about regular expressions in the chapter “Structured Requirements and RegEx Regular Expressions “), the causes of project delays and necessary adjustments to the time schedule are identified through patterns. The function written in this example extracts either the cause of delay or the time adjustment from the strings based on the patterns: highlighting the word after “because of” as the cause of delay or the word after “by” as the time adjustment.

If a row mentions a delay due to weather, “rain” is identified as the cause; if a row mentions a schedule adjustment for a specific period, that period is extracted as a time adjustment (Fig. 4.1-9). The absence of any of these words in a row results in a value of “None” for the corresponding attribute-column.
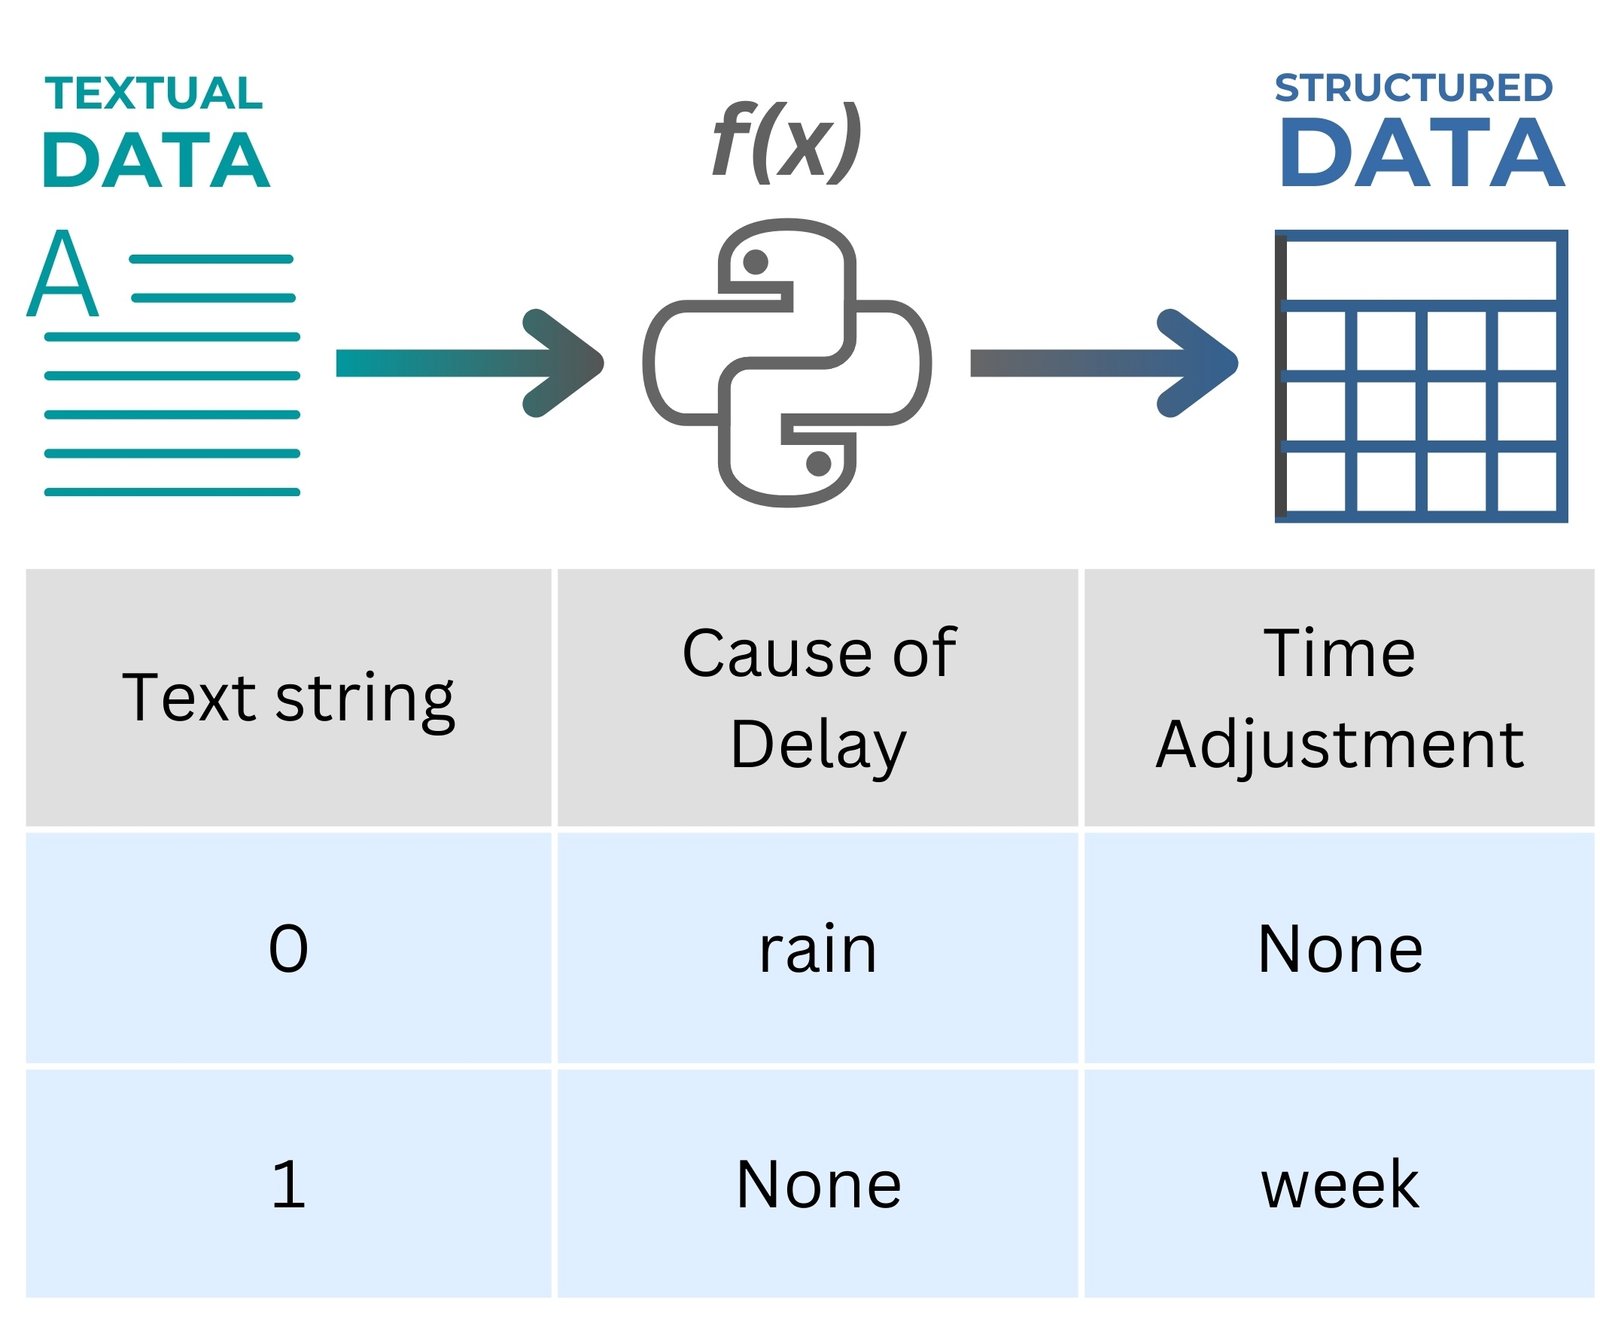
image3
Fig. 4.1-9 The summary table obtained as DataFrame, after code execution, contains information about the existence of delays and necessary time adjustments.

Structuring and parameterization of conditions from the text (dialog, letter, document) allows to promptly eliminate delays in construction: for example, lack of workers can affect the pace of work in bad weather, so companies, knowing the delay parameters from dialogs (Fig.‎ 4.1-9) between the foreman at the construction site and the project manager – in advance can strengthen the crew in case of an unfavorable forecast.

Converting documents and images into a structured format can be achieved with relatively simple, open and free categorization-based tools.

Element categorization is also a key part of working with project data, especially in the context of using CAD software (BIM).

.

Leave a Reply

Change language

Post's Highlights

Stay updated: news and insights


We’re Here to Help

Fresh solutions are released through our social channels

UNLOCK THE POWER OF DATA
 IN CONSTRUCTION

Dive into the world of data-driven construction with this accessible guide, perfect for professionals and novices alike.
From the basics of data management to cutting-edge trends in digital transformation, this book
will be your comprehensive guide to using data in the construction industry.

Related posts 

Focus Areas

Search

Search
Sorry, no articles found.

✕

Don't miss the new solutions


✕
✕

Linux

macOS

Looking for the Linux or MAC version? Send us a quick message using the button below, and we’ll guide you through the process!

✕

📥 Download OnePager

Welcome to DataDrivenConstruction—where data meets innovation in the construction industry. Our One-Pager offers a concise overview of how our data-driven solutions can transform your projects, enhance efficiency, and drive sustainable growth. 

✕

🚀 Welcome to the future of data in construction!

You're taking your first step into the world of open data, working with normalized, structured data—the foundation of data analytics and modern automation tools.

By downloading, you agree to the DataDrivenConstruction terms of use 

Stay ahead with the latest updates on converters, tools, AI, LLM
and data analytics in construction — Subscribe now!

✕

🚀 Welcome to the future of data in construction!

You're taking your first step into the world of open data, working with normalized, structured data—the foundation of data analytics and modern automation tools.

By downloading, you agree to the DataDrivenConstruction terms of use 

Stay ahead with the latest updates on converters, tools, AI, LLM
and data analytics in construction — Subscribe now!

✕

🚀 Welcome to the future of data in construction!

You're taking your first step into the world of open data, working with normalized, structured data—the foundation of data analytics and modern automation tools.

By downloading, you agree to the DataDrivenConstruction terms of use 

Stay ahead with the latest updates on converters, tools, AI, LLM
and data analytics in construction — Subscribe now!

✕

🚀 Welcome to the future of data in construction!

You're taking your first step into the world of open data, working with normalized, structured data—the foundation of data analytics and modern automation tools.

By downloading, you agree to the DataDrivenConstruction terms of use 

Stay ahead with the latest updates on converters, tools, AI, LLM
and data analytics in construction — Subscribe now!

✕

🚀 Welcome to the future of data in construction!

You're taking your first step into the world of open data, working with normalized, structured data—the foundation of data analytics and modern automation tools.

By downloading, you agree to the DDC terms of use 

✕

🚀 Welcome to the future of data in construction!

You're taking your first step into the world of open data, working with normalized, structured data—the foundation of data analytics and modern automation tools.

By downloading, you agree to the DataDrivenConstruction terms of use 

Stay ahead with the latest updates on converters, tools, AI, LLM
and data analytics in construction — Subscribe now!

✕
DataDrivenConstruction offers workshops tested and practiced on global leaders in the construction industry to help your team navigate and leverage the power of data and artificial intelligence in your company's decision making.

Reserve your spot now to rethink your
approach to decision making!

✕


🚀 Welcome to the future of data in construction!

By downloading, you agree to the DataDrivenConstruction terms of use 

Stay ahead with the latest updates on converters, tools, AI, LLM
and data analytics in construction — Subscribe now!

✕
Have a question or need more information? Reach out to us directly!
Schedule a time to discuss your needs with our team.
Tailored sessions to help your team grow — let's plan together!
✕
Have you attended one of our workshops, read our book, or used our solutions? Share your thoughts with us!
Name
✕
Data Maturity Diagnostics

🧰 Data-Driven Readiness Check

This short assessment will help you identify your company's data management pain points and offer solutions to improve project efficiency. It takes only 1–2 minutes to complete and you will receive personalized recommendations tailored to your needs.

✕

Clean & Organized Data

Theoretical Chapters:

Practical Chapters:

What You'll Find on
DDC Solutions:

  • CAD/BIM to spreadsheet/database converters (Revit, AutoCAD, IFC, Microstation)
  • Ready-to-deploy n8n workflows for construction processes
  • ETL pipelines for data synchronization between systems
  • Customizable Python scripts for repetitive tasks
  • Intelligent data validation and error detection
  • Real-time dashboard connectors
  • Automated reporting systems
✕

Connect Everything

Theoretical Chapters:

Practical Chapters:

What You'll Find on
DDC Solutions:

  • CAD/BIM to spreadsheet/database converters (Revit, AutoCAD, IFC, Microstation)
  • Ready-to-deploy n8n workflows for construction processes
  • ETL pipelines for data synchronization between systems
  • Customizable Python scripts for repetitive tasks
  • Intelligent data validation and error detection
  • Real-time dashboard connectors
  • Automated reporting systems
✕

Add AI & LLM Brain

Theoretical Chapters:

Practical Chapters:

What You'll Find on
DDC Solutions:

  • CAD/BIM to spreadsheet/database converters (Revit, AutoCAD, IFC, Microstation)
  • Ready-to-deploy n8n workflows for construction processes
  • ETL pipelines for data synchronization between systems
  • Customizable Python scripts for repetitive tasks
  • Intelligent data validation and error detection
  • Real-time dashboard connectors
  • Automated reporting systems
054 Converting text data into a structured form
This website uses cookies to improve your experience. By using this website you agree to our Data Protection Policy.
Read more
×