New data coming into the company's systems, or already collected and recorded in the form of documents, tables and databases from the property manager, architect, civil engineer, project manager and logistician must go through a validation process to ensure that it meets the requirements we have previously generated.
To validate new data coming into the systems - whether unstructured, textual or geometric - it must be converted into a loosely structured or structured format. In the validation process, each already transformed table of incoming or existing data should be checked against the complete list of required attributes and their allowed values.
The conversion of different types of data: text, images, PDF documents and mixed CAD (BIM) data into a structured form was discussed in more detail in chapter «Transforming Data Into Structured Form».
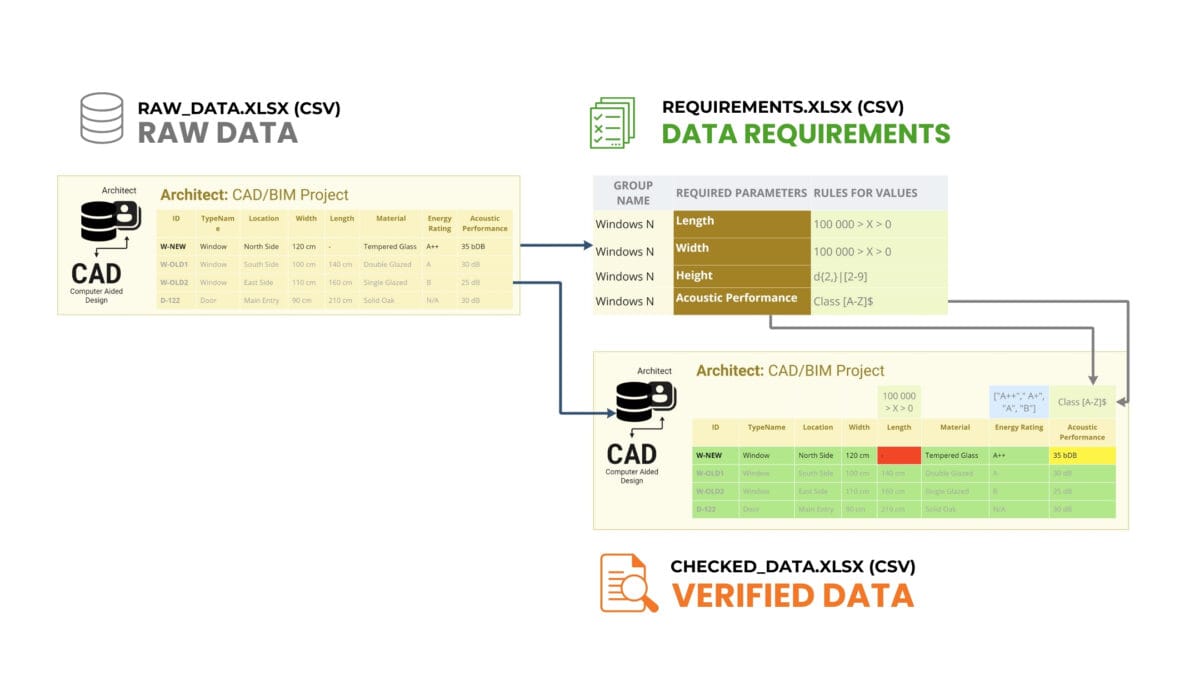
In the case of the CAD (BIM) database, which we have decomposed into a semi-structured geometry format and a structured element meta-information table, we are looking for attributes and their boundary values that other experts believe must be in the CAD (BIM) database before the data can be used outside the CAD (BIM) system.

Table of meta-information attribute data of entities from CAD (BIM) and table with attribute requirements and their boundary values for window system entities
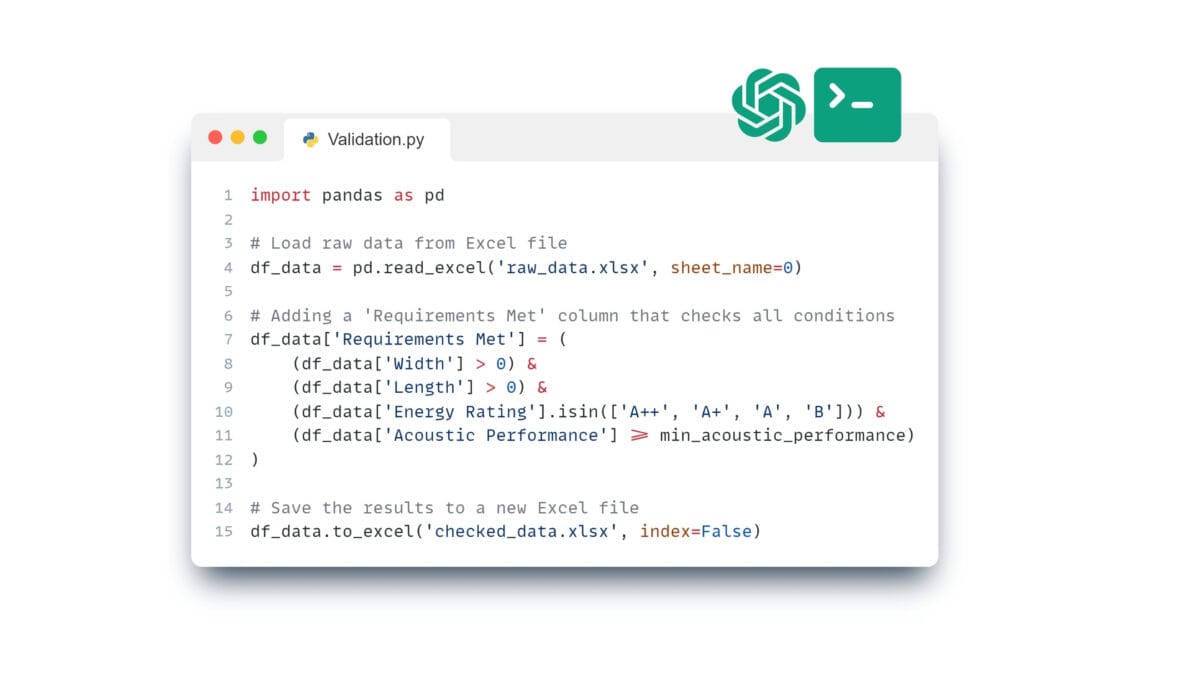
Using the Pandas library that we described earlier in the chapter "Pandas: An Indispensable Tool in Data Analysis", we will validate data from a tabular file extracted from a Revit® CAD (BIM) file (or IFC, DWG, DGN) using the requirements from another tabular file. Let's load the data from the raw_data.xlsx (Revit® CAD (BIM)) file and check it through the check and save the result to a new checked_data.xlsx file. Let's get the code to solve this problem using a text query in the ChatGPT language model, which we have already used in previous examples.
❏ Text request to ChatGPT:
Write code to validate the table from the raw_data.xlsx file, and validate them through validation rules: the values of the 'Width' and 'Length' columns are greater than zero, 'Energy Rating' is included in the ['A++', 'A+', 'A', 'B'] list, and 'Acoustic Performance' is not less than the specified minimum, with the addition of a validation summary column, and save the summary table to a new Excel file checked_data.xlsx ⏎
➤ ChatGPT Answer:

ChatGPT generated code that checks the transformed CAD (BIM) project against the attributes we generated as boundary values
This code can be run in one of the popular IDEs: PyCharm, Visual Studio Code (VS Code), Jupyter Notebook, Spyder, Atom, Sublime Text, Eclipse with PyDev plugin, Thonny, Wing IDE, IntelliJ IDEA with Python plugin, JupyterLab or popular online tools Kaggle.com, Google Collab, Microsoft Azure Notebooks, Amazon SageMaker.
Execution of the validation code will show that the "creature-elements" W-OLD1, W-OLD2, D-122 (and other elements) from the CAD (BIM) database meet the attribute requirements: width and length are greater than zero, and the energy efficiency class is one of the list values 'A++', 'A', 'B', 'C'.
The added new entity-element W-NEW, responsible for the new window on the north side, is non-compliant (Figure 2.6-7) because its length is zero and no energy efficiency class is specified for it (a value of None is considered unacceptable).

The result of the check identifies elements that have not passed the check and shows the results of the check e.g. as new attribute-columns ('False', 'True') or by highlighting incorrect values in the table
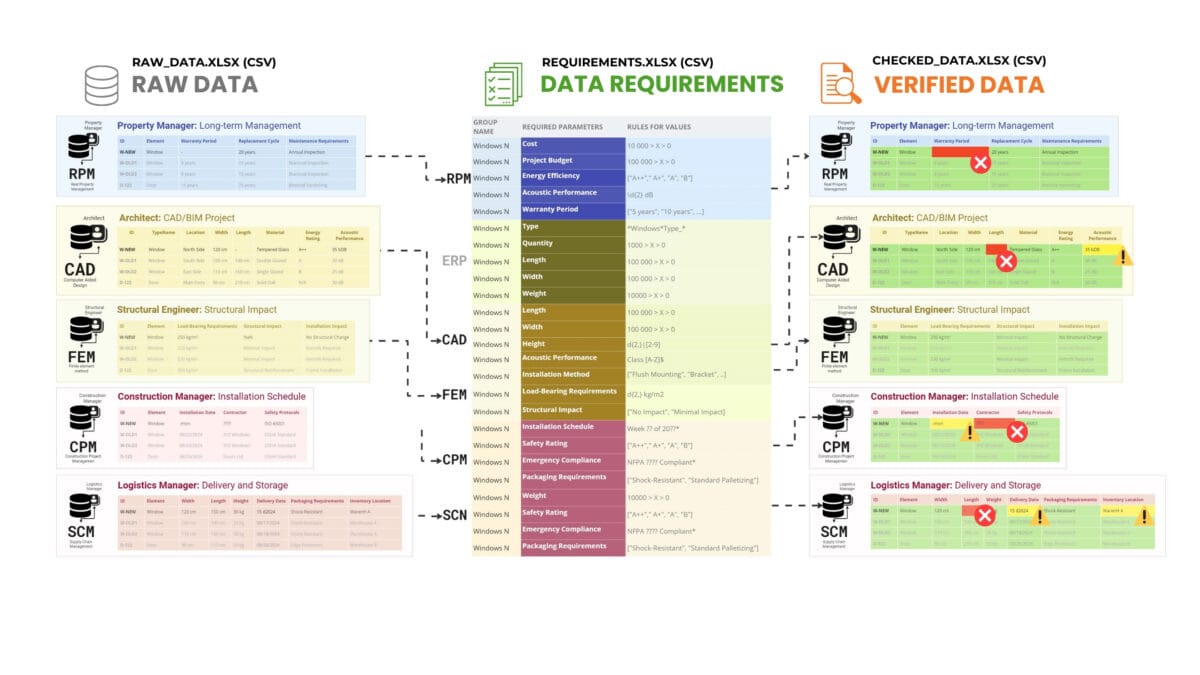
Similarly, we check the consistency of all the entities and required attributes for each of the systems, tables, databases in all the data we receive in this process of adding the window to the project.
For clarity in the resulting tables, we will mark in green those attributes and their values that are ready to be used in other construction project management systems and yellow (not critical) and red (critical) those attributes that do not meet the requirements for the entity of the window category.

The result of the check allows us to visually identify which data are not compliant
As a result of verification, we get a list of trusted and verified entity-elements with their identifiers that have been verified against attribute requirements. Verified elements now provide assurance that these elements meet the stated standards and specifications for all systems involved in the window addition process (more about automating data verification and creating an automated ETL process we will talk in the chapter "ETL and Data Verification Automation").
In the process of construction project data validation, the validation results can be presented not only in tabular form, but also through various forms of visualisation for better analysis and a better understanding of the overall quality status of the various project entities.
Visualization options for validation results in addition to summary tables can include dashboards, charts, or PDF documents that categorize items into groups based, for example, on their status - green for validated items, yellow for items requiring attention, and red for unvalidated items.
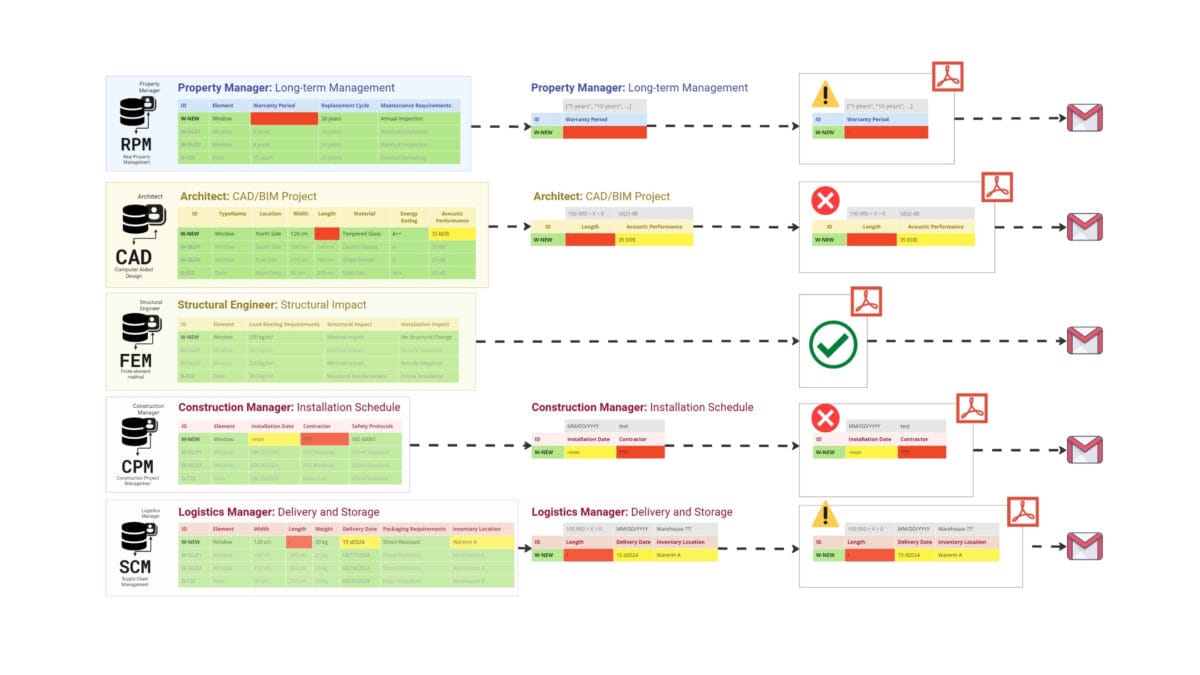
During the verification process, we consistently analysed the data (entities) from each system - from property management and CAD (BIM) data to installation schedules and logistics. In order to visualise the result of the audit, we will now automatically create suitable PDF documents for each specialist with a description of the results depending on the outcome of the audit:
- Document without comment: "Thank you for working together."
- Document with comments: "This document lists items and their attributes that have not passed the requirements validation."
Visualization of inspection results

Validation and automatic creation of reporting documents speeds up the process of finding and eliminating data deficiencies
With an automated validation process - as soon as an error or data gap is detected, we can instantly send a notification in the form of a message or a PDF document to the person responsible for the relevant data with a list of elements or entity groups with a description of the attributes that have not been validated

Visualization of inspection results in the form of automatically generated documents facilitates data interpretation and promotes effective interaction between project participants
For example, if a property management system receives a dossier that shows an incorrectly populated «Warranty Period» attribute, the property manager receives an alert with a list of their attributes that need to be checked and corrected. Similarly, any deficiencies in the installation schedule or logistics data cause a report to be automatically generated and an e-mail sent with the results of the audit to the appropriate specialist.
In addition to PDF documents and graphs with results, it is possible to create interactive 3D models with highlighting of elements with missing attributes, which allows users to visually use 3D geometries of elements to filter and evaluate the quality and completeness of data of elements in the project.
Visualization of the inspection results in the form of automatically generated documents, graphs or dashboards greatly simplifies data interpretation andfacilitates effective interaction between project participants.
Automating the data verification process has much in common with ETL procedures. In the chapter "ETL and Data Verification Automation" we will take a closer look at the topic of ETL and automation techniques for data verification.
After learning the basic types of data and systems, and mastering how to mine quality data to populate the systems, we move on to the key aspects of construction: estimating project cost and time, including volume estimation, costing, and scheduling.


